Macroeconomics is a branch of economics dealing with the performance, structure, behavior, and decision-making of an economy as a whole. Macroeconomics is the part of economics focused on the big picture: analyzing economic phenomena such as interest rates, growth, unemployment, and inflation. Macro is in contrast with microeconomics, the study of the behavior of individual markets, workers, households, and firms. Macroeconomic phenomena are the product of all the microeconomic activity in an economy.
Global is relating to, or involving, the whole world, not just one country or state.
Global Macroeconomics, or Global Macro, then, is looking at the whole world for trends and behavior of big picture trends.
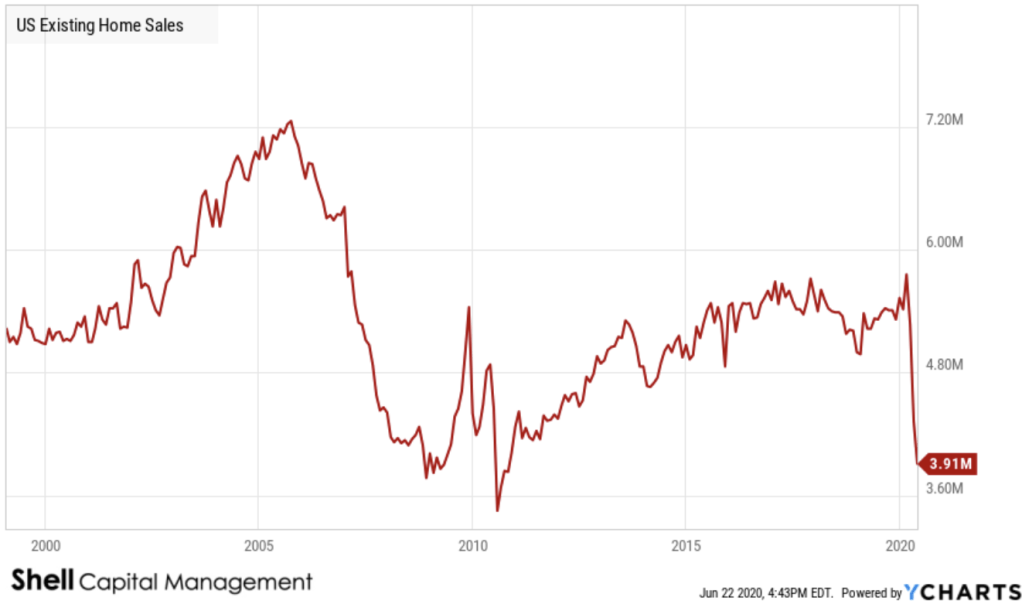
US Existing Home Sales reflects the total unit sales of US homes that are already built. It is a lagging indicator tracking the US housing market, which is impacted by changes in mortgage rates. Historically, US Existing Home Sales declined to a trough of 3.77 million units sold in November 2008 as foreclosures increased and home values fell during the US Housing Crisis.
US Existing Home Sales is at a current level of 3.91M, down from 4.33M last month and down from 5.33M one year ago. This is a change of -9.70% from last month and -26.64% from one year ago.
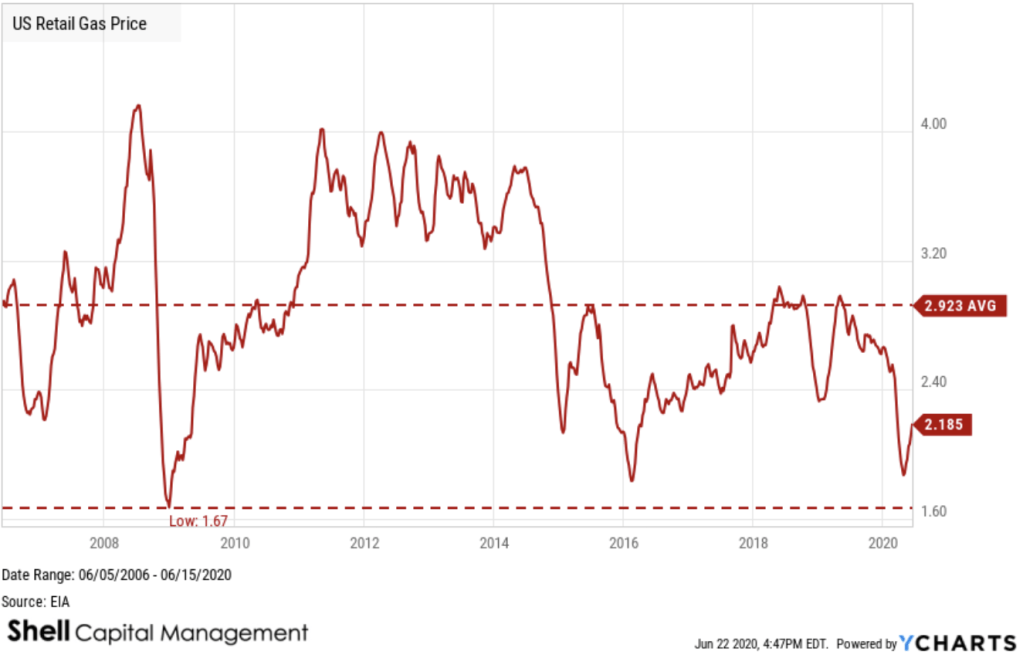
The US Retail Gas Price is the average price that retail consumers pay per gallon, for all grades of gasoline. Retail gas prices are important to view in regards to how the energy industry is performing. Additionally, retail gas prices can give a good overview of how much discretionary income consumers might have to spend.
US Retail Gas Price is at a current level of 2.185, up from 2.123 last week and down from 2.821 one year ago. This is a change of 2.92% from last week and -22.55% from one year ago. US Retail Gas Price is trending up from its recent low, which was around the same level of support gas had at prior lows of the past decade.
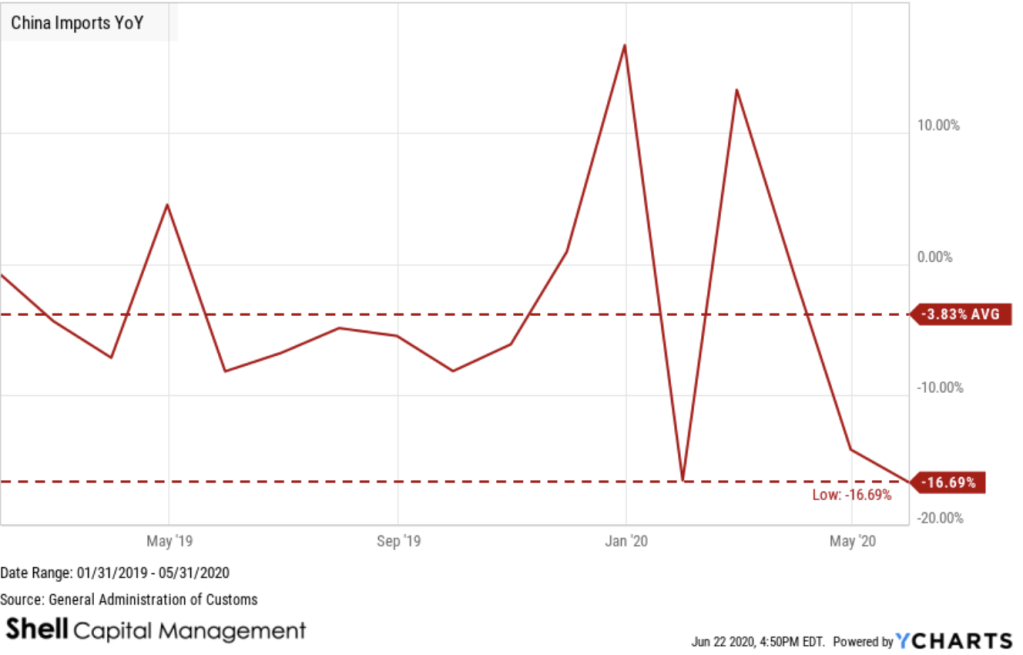
China Imports YoY is down -16.69%, compared to -14.19% last month and -8.22% last year. This is lower than the long term average of -3.83%.
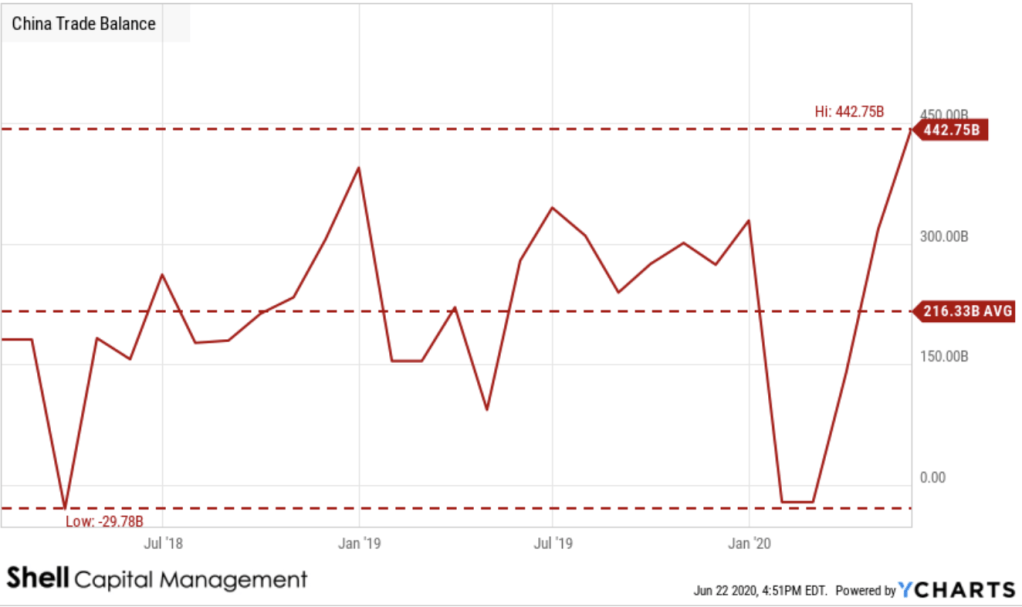
China Trade Balance is at a high of 62.93B, up from 45.33B last month and up from 41.20B one year ago. This is a change of 38.82% from last month and 52.73% from one year ago.
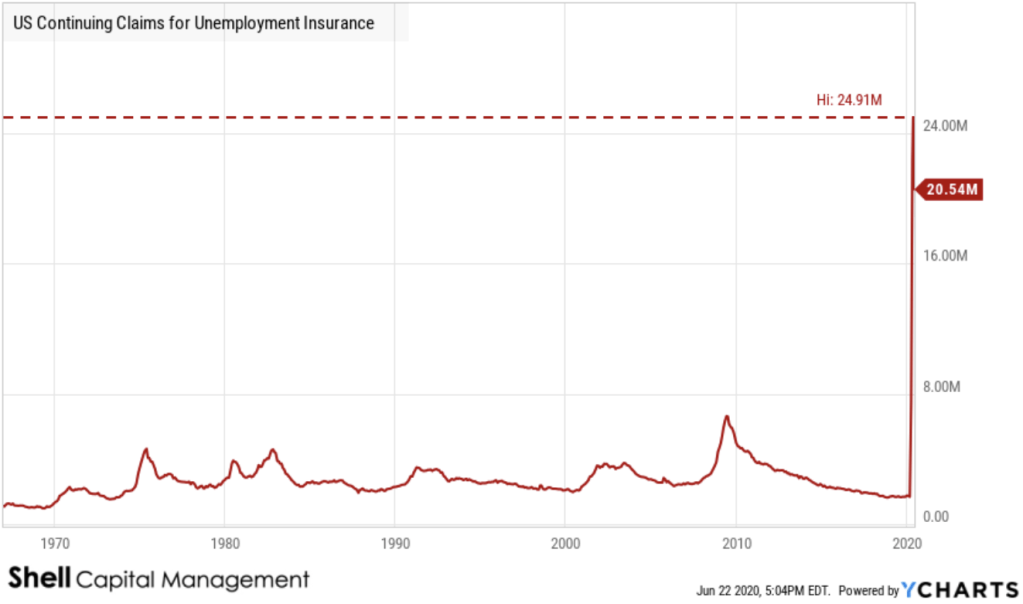
US Continuing Claims for Unemployment Insurance is at a current level of 20.54M, down from 20.61M last week and up from 1.70M one year ago. This is a change of -0.30% from last week and 1.11K% from one year ago.
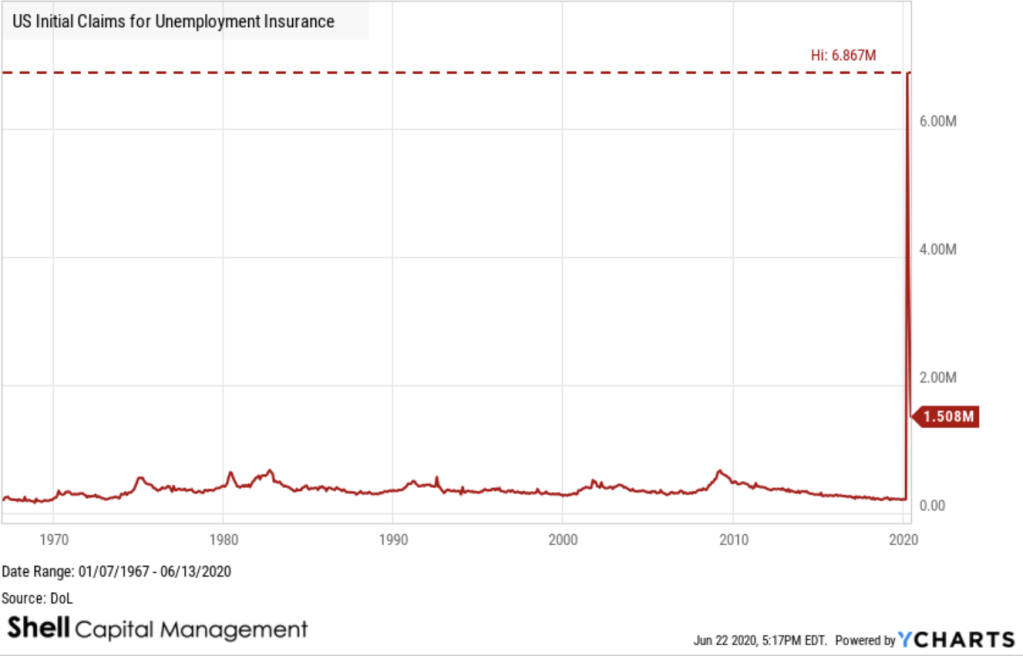
US Initial Jobless Claims, provided by the US Department of Labor, provides underlying data on how many new people have filed for unemployment benefits in the previous week. We can gauge market conditions in the US economy with respect to employment; as more new individuals file for unemployment benefits, fewer individuals in the economy have jobs. Historically, initial jobless claims tended to reach peaks towards the end of recessionary periods such as on March 21, 2009 with a value of 661,000 new filings.
US Initial Claims for Unemployment Insurance is at a current level of 1.508M, down from 1.566M last week and up from 222,000 one year ago. This is a change of -3.70% from last week and still up 579.3% from one year ago.
Equity option demand continues to be focused on call buying relative to put options.
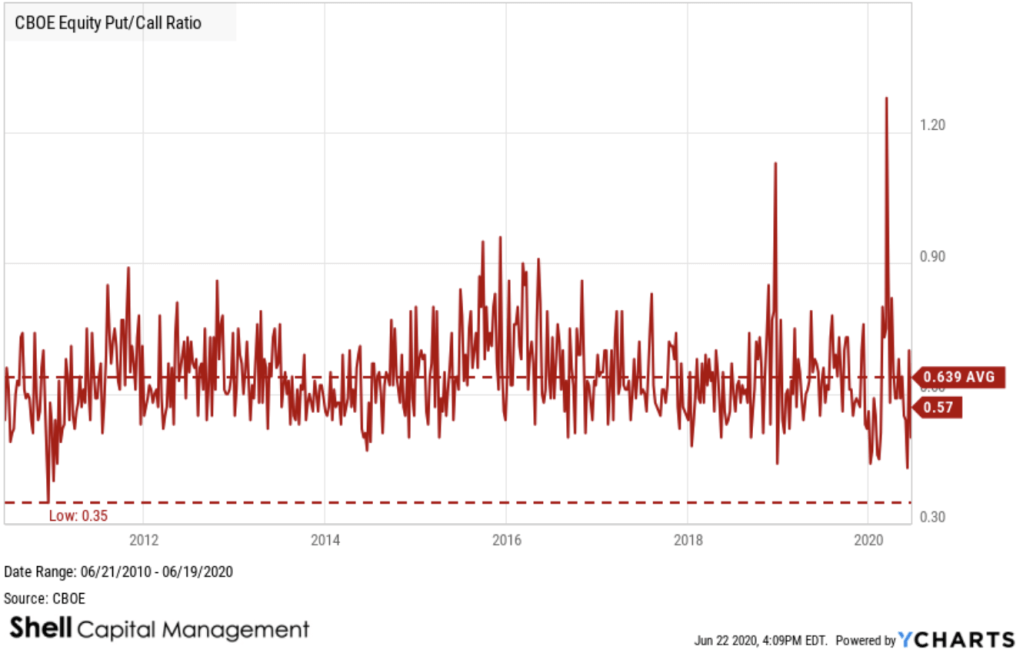
The CBOE Equity Put/Call Ratio had reached a very low level, indicating options traders were mostly operating in speculative call options over put options for hedging.
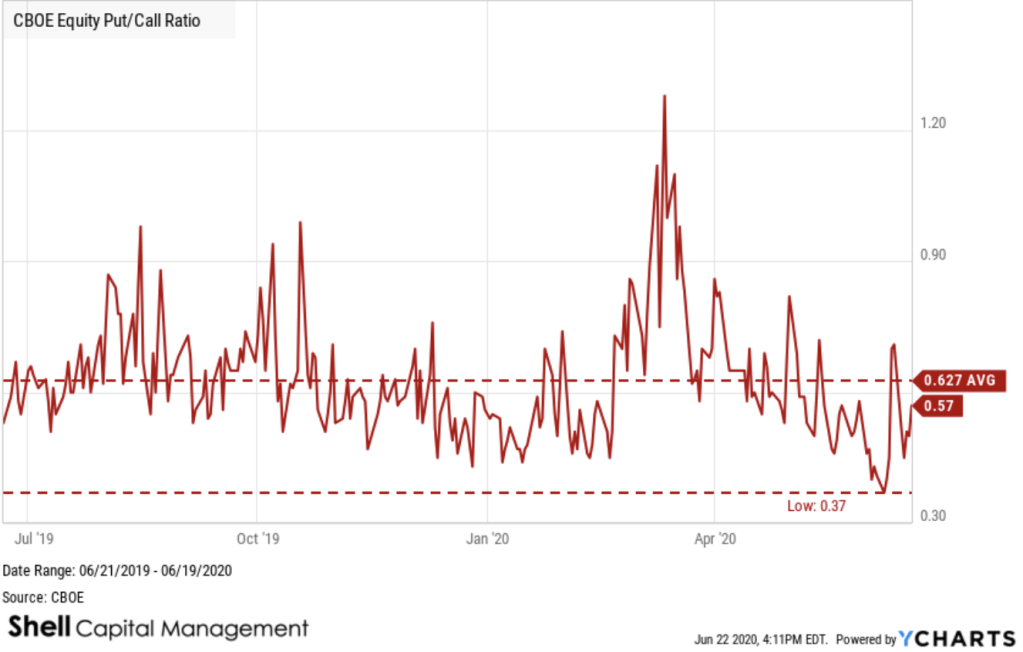
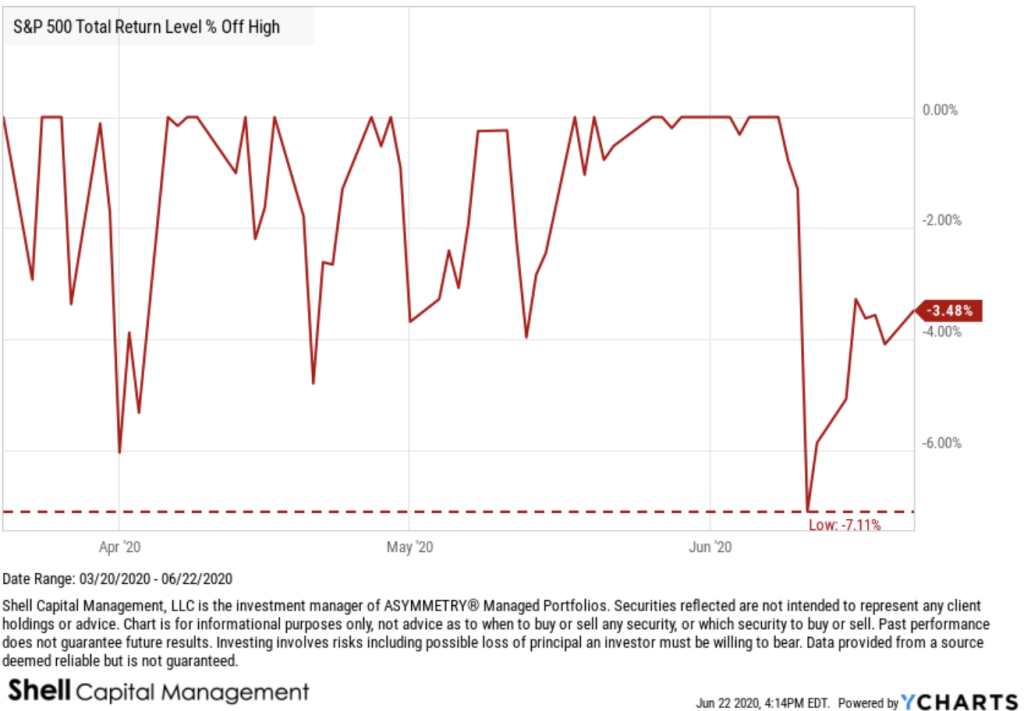
I pointed out in “Volatility contractions are eventually followed by volatility expansions” on May 27th:
“CBOE Equity Put/Call Ratio is trending toward the low level was saw before the waterfall decline in March. A falling put-call ratio, or a ratio less than 1, means that traders are buying fewer puts than calls. It suggests that bullish sentiment is building in the market.”
Shortly after, we saw a -7% decline in the stock indexes.
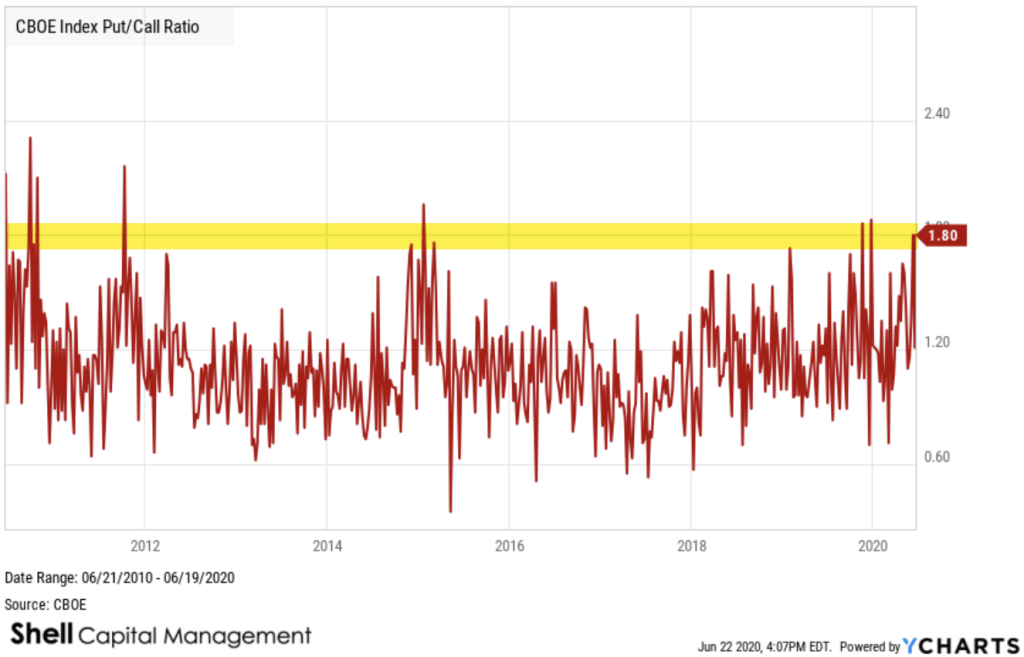
However, I’m seeing evidence of hedging now. The CBOE Index Put/Call Ratio shows a relatively high degree of hedging with put options.
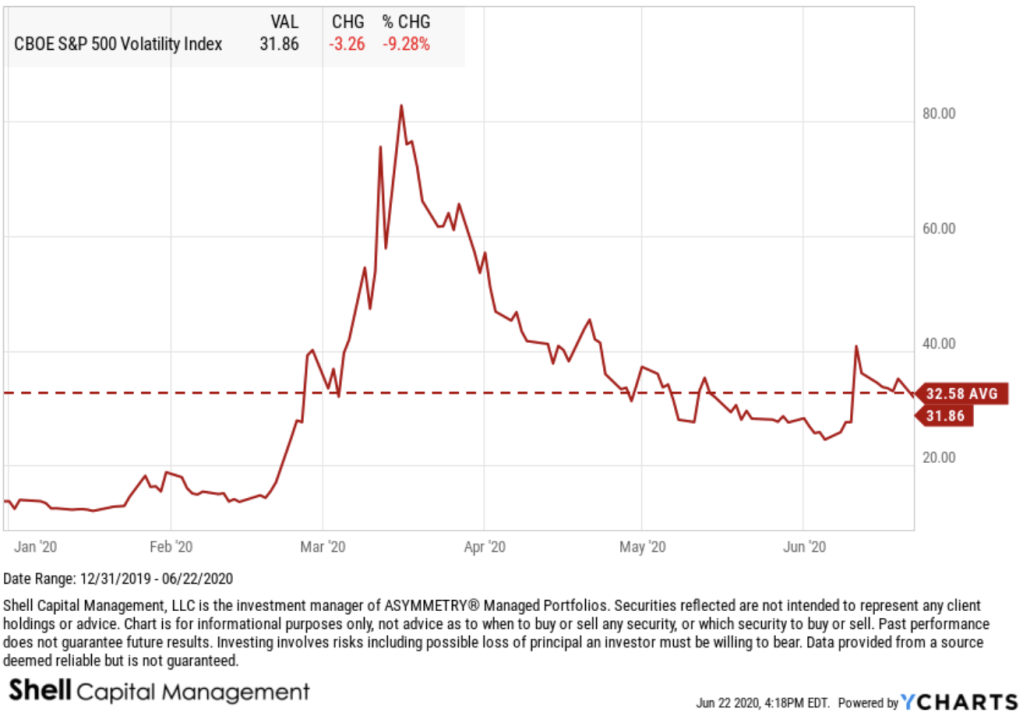
Implied volatility as measured by the CBOE Volatility Index (VIX) remains very elevated, even though it declined nearly 10% today. In fact, it has mean reversed, as it does. The VIX is at its one year average.
Global Macro trends are all over the place.
Mike Shell is the Founder and Chief Investment Officer of Shell Capital Management, LLC, and the portfolio manager of ASYMMETRY® Global Tactical. Mike Shell and Shell Capital Management, LLC is a registered investment advisor focused on asymmetric risk-reward and absolute return strategies and provides investment advice and portfolio management only to clients with a signed and executed investment management agreement. The observations shared on this website are for general information only and should not be construed as advice to buy or sell any security. Securities reflected are not intended to represent any client holdings or any recommendations made by the firm. Any opinions expressed may change as subsequent conditions change. Do not make any investment decisions based on such information as it is subject to change. Investing involves risk, including the potential loss of principal an investor must be willing to bear. Past performance is no guarantee of future results. All information and data are deemed reliable but is not guaranteed and should be independently verified. The presence of this website on the Internet shall in no direct or indirect way raise an implication that Shell Capital Management, LLC is offering to sell or soliciting to sell advisory services to residents of any state in which the firm is not registered as an investment advisor. The views and opinions expressed in ASYMMETRY® Observations are those of the authors and do not necessarily reflect a position of Shell Capital Management, LLC. The use of this website is subject to its terms and conditions.

You must be logged in to post a comment.