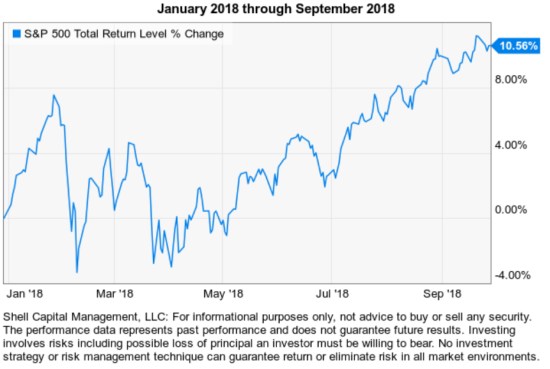
The stock market started last year with a sharp gain. By the end of January 2018, the S&P 500 stock index was up 8% and bullish investor sentiment followed it. Then, it declined -10% in February quickly. After retesting the February low in April, it started to trend back up. By the end of September, the stock market was at an all-time high again, and up nearly 11% for the year.
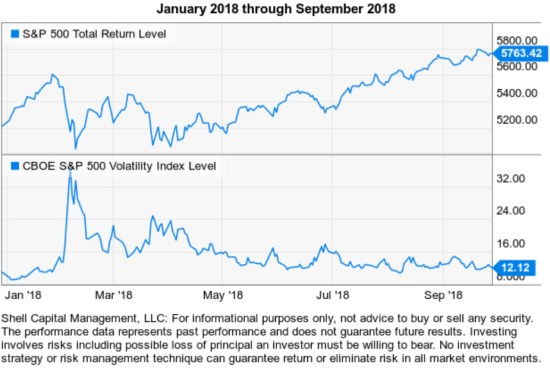
For a broader observation, I included the VIX CBOE Implied Volatility Index below the SPX price trend chart below. As the stock index price trend fell, the VIX spiked up. As the price trend trended back up, implied/expected volatility measured by the VIX declined to a historical extreme low of 12. It developed into a quiet trending uptrend. It was the kind of condition that trend following systems are designed to exploit. It’s also the kind of condition that drives more exposure to risk from volatility targeting strategies that increase exposure as volatility evaporates and decrease exposure to loss when volatility expands.
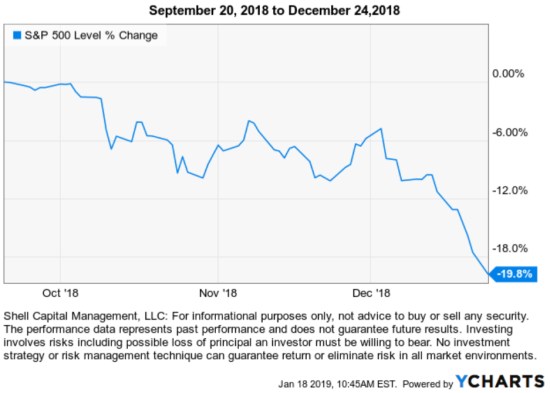
Then came October.
The month of October has a bad reputation with some investors because they remember the crash of October 1987. However, September is more often the down month. The average return in October is positive historically, despite the record declines of -19.7% in 1929 and -21.5% in 1987. Based on history, October has a higher probability of a gain than a loss.
From October through December, the S&P 500 commenced to falling nearly -20%. The month of December going into Christmas Eve was especially brutal with panic selling driving a waterfall decline.
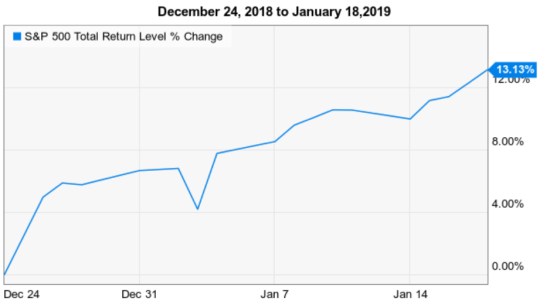
As I shared several times here, eventually those who want to sell have sold and new buying demand steps in when prices reach a low enough point to drive their enthusiasm to buy. After the waterfall decline, that’s exactly what we’ve seen since the beginning of January. Those who added or increase their exposure have been rewarded, those who decreased their exposure are probably feeling the fear of missing out. The S&P 500 has gained about 13% since the low on December 24th and nearly 6% year to date in 2019.
Getting technical, I like to see a visual of the price trend and define it with trend lines for observation. Below we see the same line I wrote about in Will the stock market hold the line? in November as potential support (that wasn’t) came back into play as potential resistance (that isn’t.) Support and resistance is only a “potential” unless it actually is. The SPX has cleared the line and is trending above that prior price level that held twice and broke badly the third time.
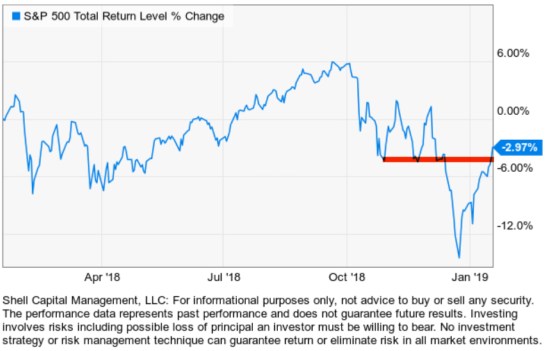
The stock market is up sharply today after this breakout, expected volatility VIX is decreasing, and we see an expansion in breadth and momentum.
While the stock market has reached a point we may see at least a temporary decline, it is instead trending up at this point. The driver could be those who panicked at the lows now becoming overwhelmed by the fear of missing out. It could also be the same volatility targeting programs that sold into the volatility expansion now reentering as volatility is decreasing. So, this trend could run longer than many expect it to if it’s driven by enough buying demand.
We’ll see if it holds the line again. But, Semper Gumby: last year started out this way, too.
Mike Shell is the Founder and Chief Investment Officer of Shell Capital Management, LLC, and the portfolio manager of ASYMMETRY® Global Tactical.
The observations shared on this website are for general information only and are not specific advice, research, or buy or sell recommendations for any individual. Investing involves risk including the potential loss of principal an investor must be willing to bear. Past performance is no guarantee of future results. The presence of this website on the Internet shall in no direct or indirect way raise an implication that Shell Capital Management, LLC is offering to sell or soliciting to sell advisory services to residents of any state in which the firm is not registered as an investment advisor. Use of this website is subject to its terms and conditions.

You must be logged in to post a comment.