Burton Malkiel is a passive buy and hold investor who believes markets are random. To believe markets are random is to believe there are no directional trends, or high or low valuations. He is the author of “A Random Walk Down Wall Street“. But in today’s Wall Street Journal even the ” Random Walker” sees that stock valuations are high and future expected returns low, but believes if there is a bubble it’s in bonds.
By
BURTON G. MALKIEL
June 1, 2015 6:58 p.m. ET
“Stock valuations are well above their average valuation metrics of the past, and future returns are likely to be below historical averages. But even as Ms. Yellen talks of gradually ending the Fed’s near-zero interest rate policy, interest rates remain well below historical norms. If there is a market bubble today, it is in the bond market and the Fed is complicit in the “overvaluation.”
Source: http://www.wsj.com/articles/janet-yellen-is-no-stock-market-sage-1433199503
When someone invests in bonds for the long term they mainly intend to earn interest. So, bond investors want to buy bonds when yields are high. In the chart below, I show the iShares iBoxx $ Investment Grade Corporate Bond index ETF that seeks to track the investment results of an index composed of U.S. dollar-denominated, investment grade corporate bonds. The blue line is its price trend, the orange line is the index yield. We observe the highest yield was around 5.33% during a spike in 2008 when the price declined. Fixed income has interest-rate risk. Typically, when interest rates rise, there is a corresponding decline in bond values. Since 2008, interest rates and the yield of this bond index has declined. Clearly, the rate of “fixed income” from bonds depends on when you buy them. Today, the yield is only 2.8%, so for “long term allocations” bonds aren’t nearly as attractive as they where.
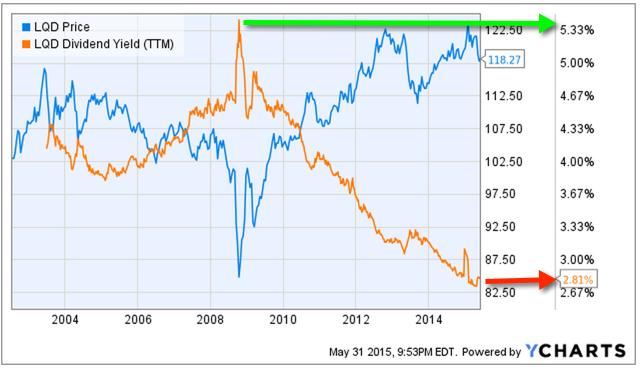
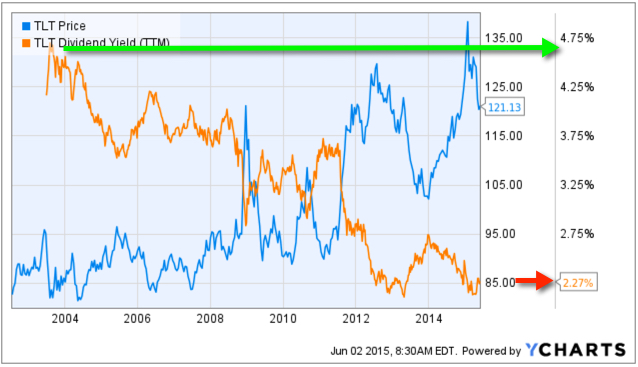
However, that doesn’t mean we can’t tactically rotate between these bond markets trying to capture price trends rather than allocate to them.
Chart source: http://www.ycharts.com

You must be logged in to post a comment.