It seemed that many of the commentators who write and talk about the VIX started talking as though it would stay down a long time. Of course, that’s as much a signal as anything that the trend could instead change.
Below is a chart of the CBOE Volatility Index (VIX) since I observed “VIX Back to Low” on July 3. It says to me that volatility, is, well, volatile. It trended up as much as 34% and then retraced much of that.
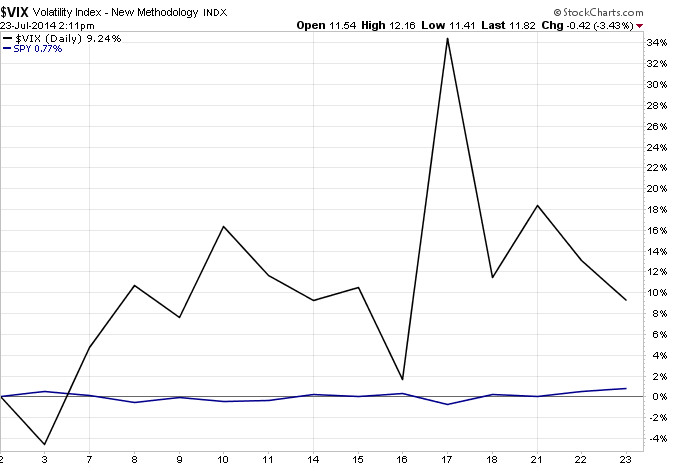
source: http://www.stockcharts.com
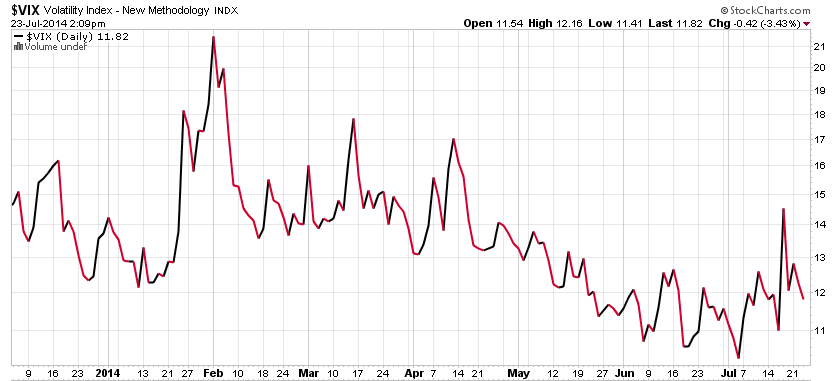
Looking back the past several months, we can see since the beginning of July it has started to make higher highs and higher lows. Volatility (and therefore some options premiums) are still generally cheap by this measure, but from the eyes of a trend follower I wonder if this may be the very early stage of higher vol. We’ll see…
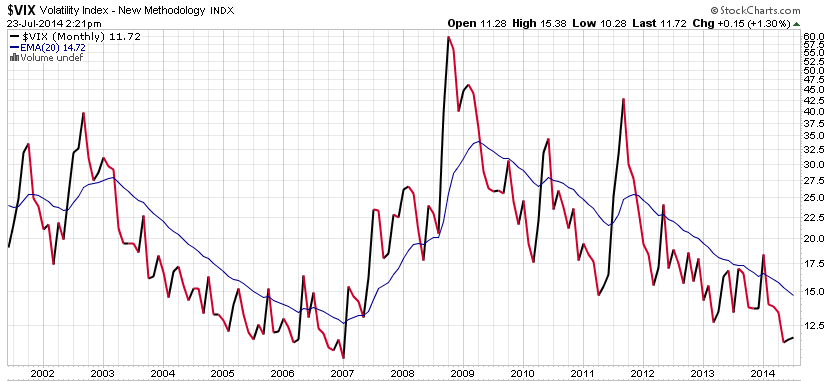
Either way, whether it stays low or trends back up, the monthly chart below shows the implied volatility in options is “cheaper” now than we’ve seen in 7 years, suggesting exposures with options strategies may be a “good deal”.

You must be logged in to post a comment.