The CBOE Volatility Index (VIX) reached a low point last week not seen since 2007 as evidenced by the chart below.
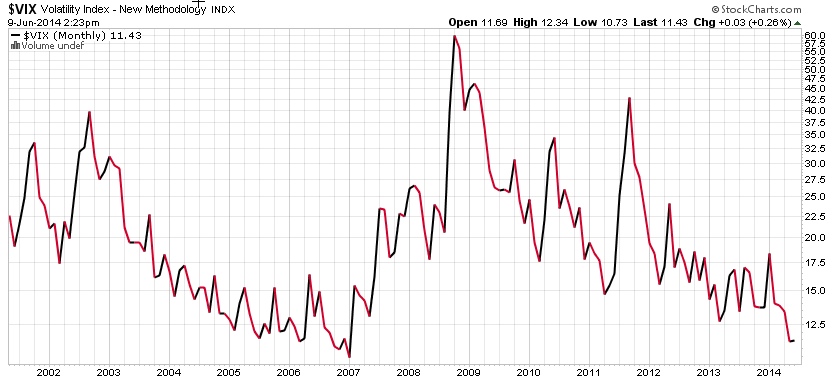
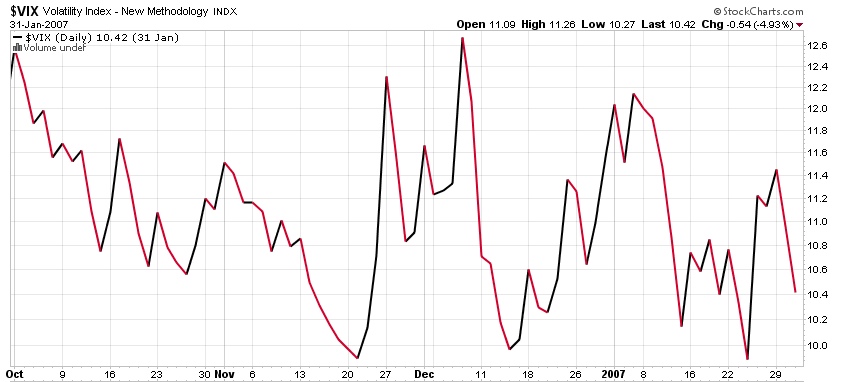
To see a closer view of the last period, below I included the last time the VIX was at such a low value. I show this to point out that the VIX oscillated between 9% and 12% for about 4 months before it finally spiked up to 20. Such a trend reversal (or mean reversion if you prefer) can take time. Imagine if the VIX stays this low for the next 4 months before a spike. Or, it could happen very soon. You may notice the VIX reached the level it is now at its lowest level in early 2007. If we believed these trends repeat perfectly, that absolute level would matter. Trends are more like snowflakes: no two are exactly the same. But in relative terms, the fact that today’s level is as low as the lowest point in early 2007 is meaningful if you care about the risk level in stocks and the stage of the market cycle.
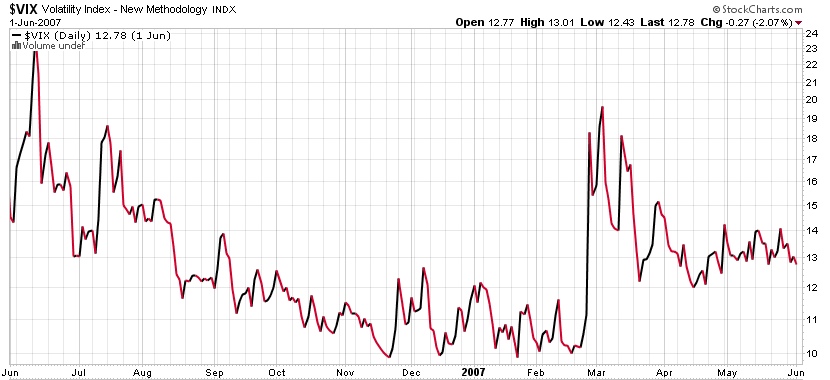
The best way to examine a trend is to zoom in. Start with a broader view to see the big picture, then zoom in closer and closer. When people focus too much on the short-term, they miss the forest for the trees. Below is the last time the VIX was below 12. You may notice that is does oscillate up and down in a range.
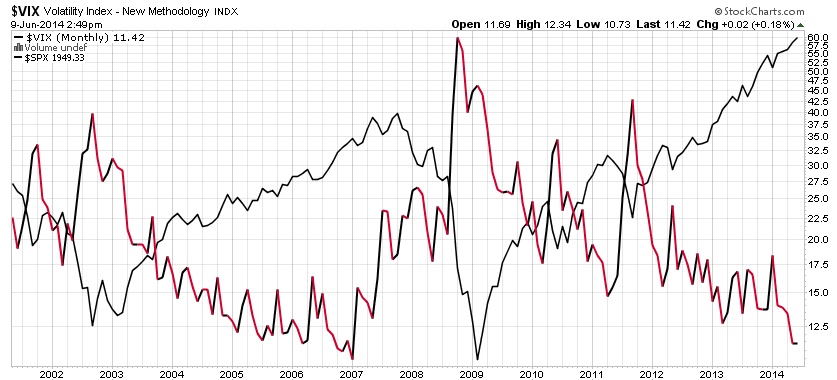
The level and directional trend of the VIX matters because of the next chart. You may see a trend if you look closely. The black line is the S&P 500 stock index. The black and red line is the VIX CBOE Volatility Index. You may notice the two tend to drift in opposite directions. Not necessarily on a daily basis, but overall they are “negatively correlated”. When the stock index is rising, the volatility is often falling or already at a low level. When the stock index is falling, volatility rises sharply. It isn’t a perfect opposite, but it’s there.
If you are interested in stock trends and the trend in volatility, and specifically the current state of those cycles, you may want to follow along in the coming days. I plan to publish a series on this topic about the VIX, as I see it. Over the last week or so I have written several ideas that I intended to publish as one large piece. Since I haven’t had time to tie it together that way, I thought I would instead publish a series.
When a trend reaches an extreme level like this, it may be useful to spend some time with it.
Stay tuned…
if you haven’t already, you may want to click on “Follow” to the right to get updates by email to follow along. This will likely be several informal notes in the coming days.

You must be logged in to post a comment.