As the U.S. unemployment rate in April 2020 was 14.7%, the highest since the Great Depression, the U.S. stock market is trending up.
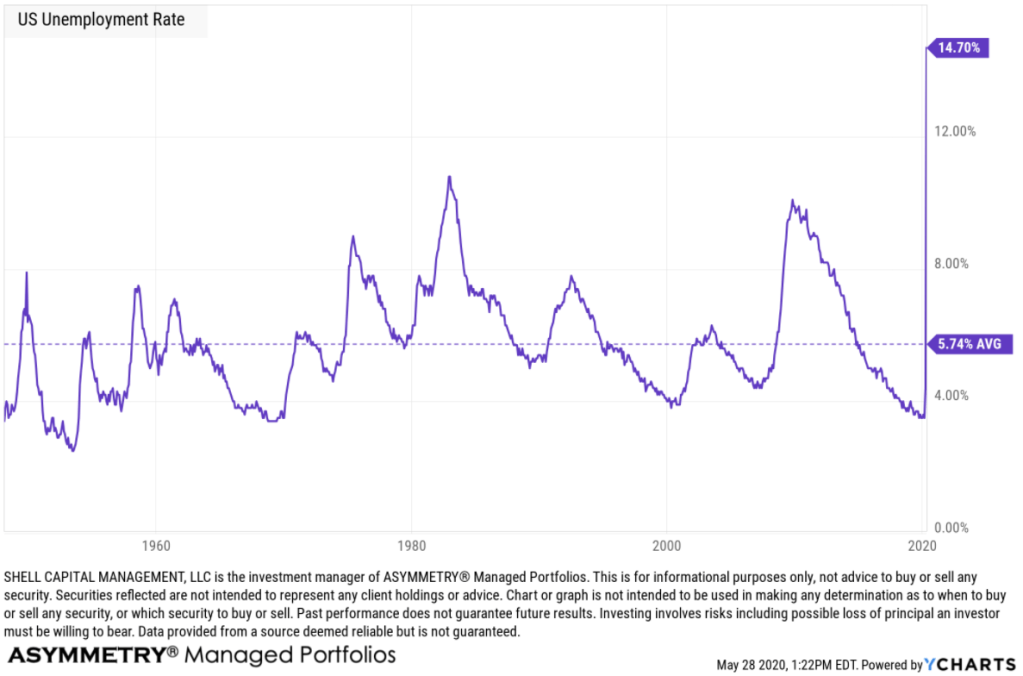
And May’s unemployment number may be higher when it’s announced on June 5.
The stock market is said to be a discounting mechanism. The largest stock market investors who drive price trends don’t look back, they look forward.
It’s an auction market and operates on the proposition that investors and traders gaze into the future and discounts all known information about the present moment and expectations for what’s expected to happen next. So, when unexpected events happen, the market takes into account this new information very rapidly.
It certainly seems to be happening now.
Either the market is factoring in a quick recovery, or something else is driving it up.
The Efficient Markets Hypothesis (EMH) is based on the theory that the stock market is a very efficient discounting system, so it factors in expectations of the future. The Efficient Markets Hypothesis suggests the stock market generally moves in the same direction as the economy.
Yeah, I know. If there ever was a time that sounds silly it’s now. Well, and every other market crash and bubble. I’ve seen my fair share of those in the past two decades.
One of the most interesting paradoxes in investment management is the market discounts everything is also the first premise of Technical Analysis.
The three premises on which the technical approach is based:
- Market action discounts everything.
- Prices move in trends.
- History repeats itself.
That both the Efficient Markets Hypothesis and Technical Analysis is based on the belief the market discounts everything known and expected about the future is logically self-contradictory, because EMH doesn’t believe prices move in trends. EMH certainly doesn’t believe Technical Analysis, including trend identification systems for trend following and pattern recognition, is useful. Yet, trend systems and pattern recognition are some of the very strategies that I’ve seen to achieve asymmetric risk-reward.
I consider most trend identification systems to be pattern recognition. Pattern recognition is the systematic recognition of patterns in data. For example, the first action in trading breakouts is to identify current price trend patterns along with potential support and resistance levels in order to signal entry and exit points.
So, here we are. The S&P 500 is now trading above its 200 day moving average again after trending below it on February 27th.
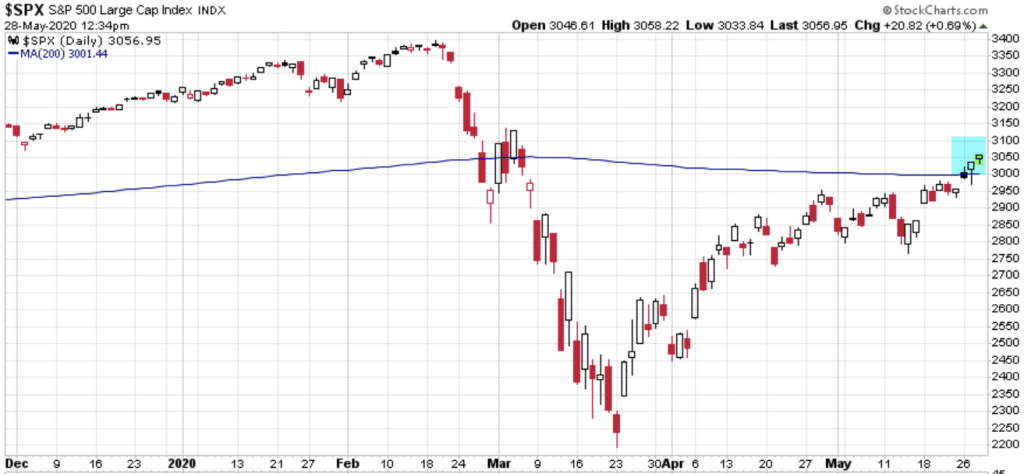
It has been shocking to most that the stock index is now only down about -10% from its February high after a -36% waterfall decline over just 23 trading sessions.
It the fastest waterfall we’ve seen of this magnitude, so maybe we shouldn’t be surprised to see it swing back up to recover 2/3rds of the decline.
But no, it’s not a surprise. I tactically traded through the last two most radical bear markets since the Great Depression and they both included many swings up and down along the way.
The swings are the danger.
If you wait too long and enter after prices have already trended up sharply, you may get invested in stocks just in time for the next trend down.
The same goes for the downside. If you wait until your losses are so large they become intolerable and tap out at the lows, you risk missing out on the price trend recovery like we just saw.
At what point do you feel good about geting back in?
After prices have trended back up as they have now? The S&P 500 is above the 200 day moving average, so it’s a sign of an uptrend.
Is this the time to buy?
Or, do you feel better about investing in stocks after the price trend falls more?
What if it doesn’t?
These are tactical trading decisions. Most investors are not good at it, but some of us are better.
The market is people who trade and invest in the market. People are always looking forward, gazing into the future that doesn’t yet exist, so prices are always adjusting according to people’s beliefs about what’s going to happen next. This includes all signals. All signals are necessarily predictions of the future.
As the SPX is now trending above its 200-day average, trend followers who use the SMA will buy here. We may indeed see some buying interest come in because of it. Only time will tell if its enough buying pressure to drive prices up more. I’ve been operating trend systems for decision-making for over two decades and I don’t know of any money manager who actually trades off a 200-day moving average signal, except one. I’m going to save it for another observation, but until then, I’ll simply share this.
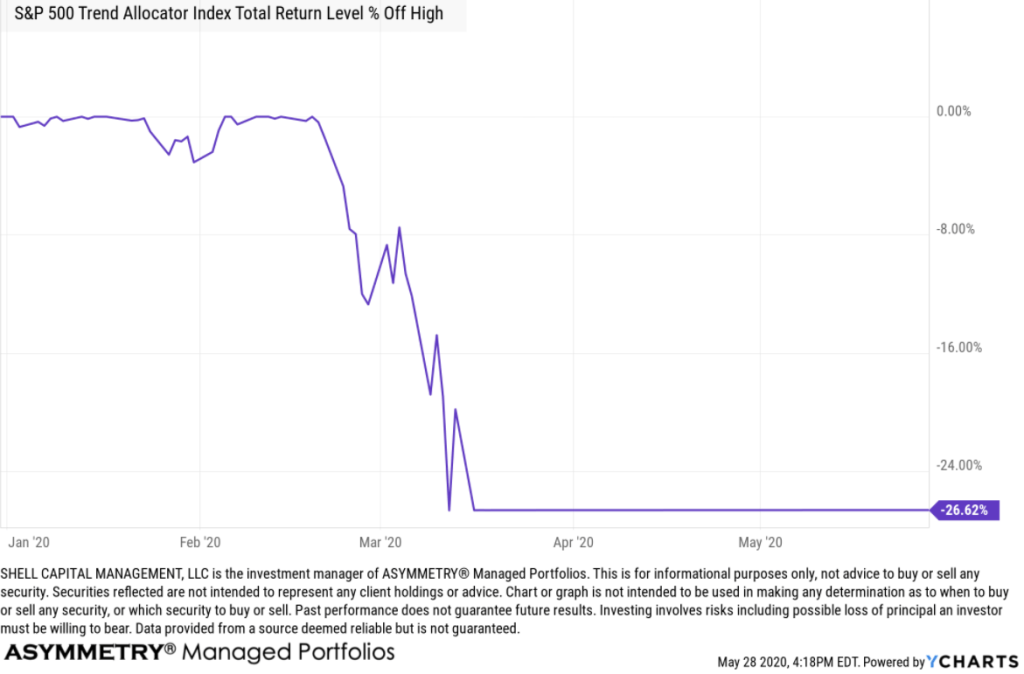
The S&P Trend Allocator Index is designed to track the performance of a systematic trend-following strategy allocating between the S&P 500 and cash, based on price trends. If the S&P 500 is observed to be in a positive trend, then the index is allocated to the S&P 500, otherwise, it is allocated to cash.
Here is the S&P Trend Allocator Index relative to the S&P 500 stock index which is fully invested, all the time.
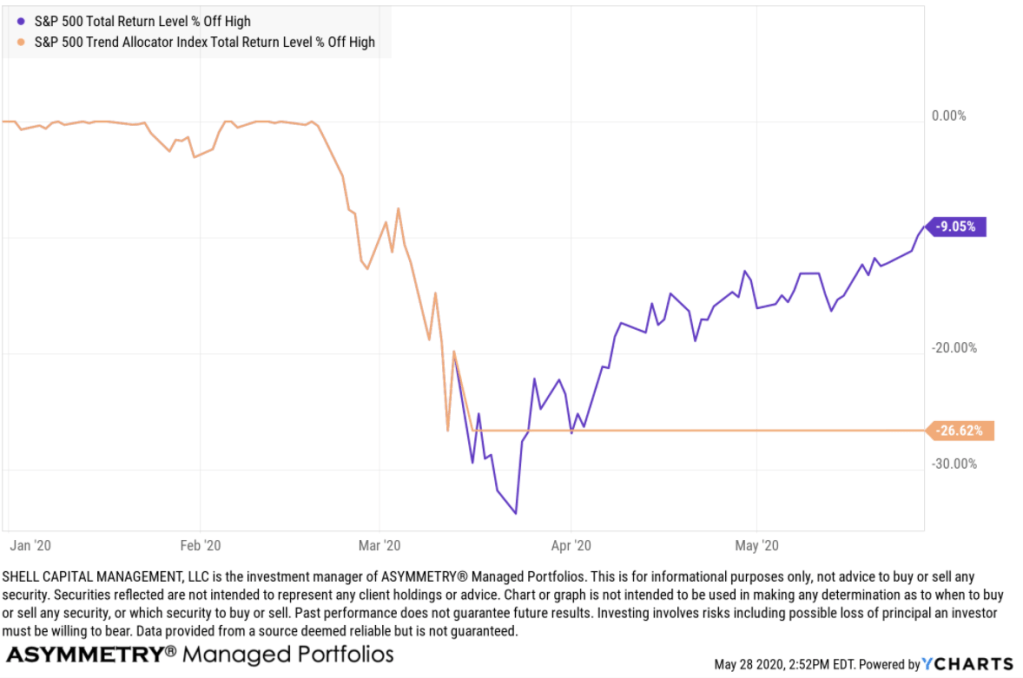
Oops.
Prior to the waterfall decline, the S&P 500 was trending 11% higher than its 200 day moving average. So, it was going to have at least a -11% drawdown with perfect execution. That’s a nice thing about it. It’s a predefined exit, so at the February high, you knew if the stock market falls, you’ll lose at least -11% before you exit. When we know our defined risk, we can decide to accept it, or not. If you were trading off the 200 SMA and believed a -11% drawdown was unacceptable, you could have raised your stop above it.
But then, if you sold earlier, how would you know when to get back in?
Ok, I just wanted to drive home the point: tactical trading decisions aren’t easy. No indicator works perfectly.
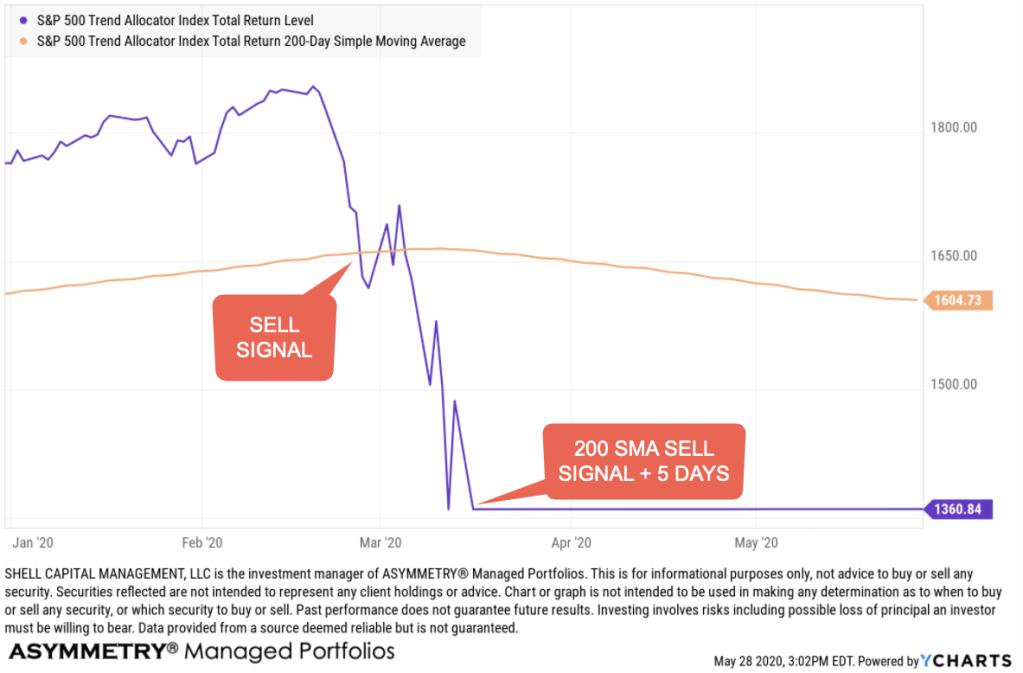
I don’t use the 200 SMA, but the S&P Trend Allocator index does. However, you may notice it didn’t sell at the price trend break below the 200 SMA. Instead, it sold later, and down much more. The S&P Trend Allocator Index sold later because it waits until five days after a crossover to sell. I marked on the chart the point on the price trend it actually sold.
S&P Trend Allocator Index Construction
“At the close of each business day, a trend signal is calculated based on the closing value of the S&P 500 Total Return Index (the “Allocation Indicator Index”) compared to its prior 200-day Simple Moving Average (SMA). The SMA is defined as the average of the last 200 closing values of the S&P 500 Total Return index. The trend signal is positive if the last five consecutive closing values of the S&P 500 Total Return index are equal to or greater than the SMA. The trend is negative if the last five consecutive closing index values are below the SMA. The trend signal does not change from its current status until there have been five consecutive days of index values indicating a signal change.”
I’m not going to get any deeper on this right now, but I will in a later observation, but the drawdown in the S&P Trend Allocator Index was about -27%.
Keep in mind; an index does not include any transaction cost or fees and may not be invested indirectly. If we were applying this trend following method with real money, there would have been transition costs, fund fees, advisory fees, and slippage to account for which would have negatively impacted the return profile. With that said…
Should we care that the S&P 500 is above its 200-day simple moving average?
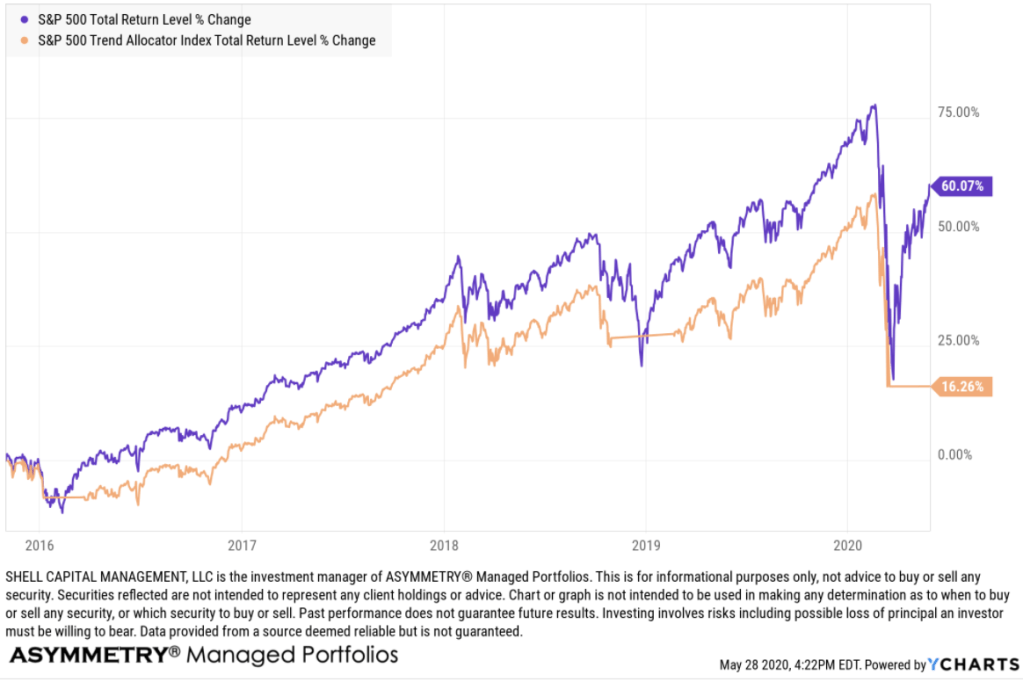
Since the index was operated in real-time, above is the total return relative to its S&P 500 stock index which is fully invested in stocks all the time.
Here is the drawdowns for a complete picture of its risk-reward profile.
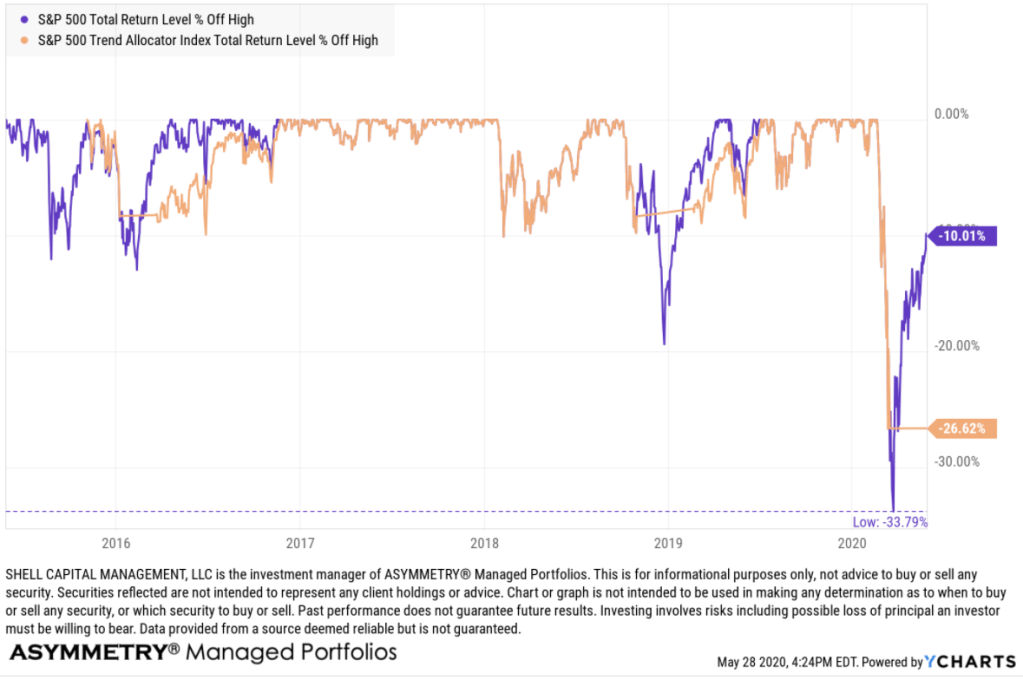
As you see, the S&P Trend Allocator applying the 200-day moving average to the S&P 500 had a drawdown of -27% vs. the -34% drawdown of the S&P 500.
So, the risk management method of the S&P Trend Allocator provided a drawdown control edge of about 7% relative to the fully invested stock index that is exposed to the risk and reward of the stocks all the time.
However, the total return is materially less at this point. Although the S&P Trend Allocator 200 day SMA exit signal exits with a lag and then reenters with a lag, it has participated in most of the stock market drawdowns and then misses out on the early part of its gains off the lows when the rate of change is highest.
It will take a larger downtrend for the 200 day SMA to show its value. The magnitude of the March decline was tremendous, but it happened so fast the lag was exposed as a risk to the strategy.
Now, just imagine how the risk/reward profile will be impacted if it enters the stock market right now, and then the market trends down again. This is one of the risks to be aware of with any trend-following or tactical trading system or method.
No investment strategy is ever perfect, but we gain an edge when we are aware of their weaknesses. I have spent more time trying to break my systems and methods to discover weaknesses than I did creating them.
Mike Shell is the Founder and Chief Investment Officer of Shell Capital Management, LLC, and the portfolio manager of ASYMMETRY® Global Tactical. Mike Shell and Shell Capital Management, LLC is a registered investment advisor focused on asymmetric risk-reward and absolute return strategies and provides investment advice and portfolio management only to clients with a signed and executed investment management agreement. The observations shared on this website are for general information only and should not be construed as advice to buy or sell any security. Securities reflected are not intended to represent any client holdings or any recommendations made by the firm. Any opinions expressed may change as subsequent conditions change. Do not make any investment decisions based on such information as it is subject to change. Investing involves risk, including the potential loss of principal an investor must be willing to bear. Past performance is no guarantee of future results. All information and data are deemed reliable but is not guaranteed and should be independently verified. The presence of this website on the Internet shall in no direct or indirect way raise an implication that Shell Capital Management, LLC is offering to sell or soliciting to sell advisory services to residents of any state in which the firm is not registered as an investment advisor. The views and opinions expressed in ASYMMETRY® Observations are those of the authors and do not necessarily reflect a position of Shell Capital Management, LLC. The use of this website is subject to its terms and conditions.

You must be logged in to post a comment.