It’s essential to make observations about the big picture to see what is going on, since the longer trends eventually have an impact on shorter trends.
Before March, the US economy was in the longest economic expansion on record. It was aged, to say the least. I pointed out several times the past year unemployment was at an all time historic low at 3% or so.
Now it’s 14.7%.

The stock market was in the longest bull market, ever. An uptrend in stocks is usually around 4-5 years before being interrupted by a -20% bear market decline.
This time it was 11 years.
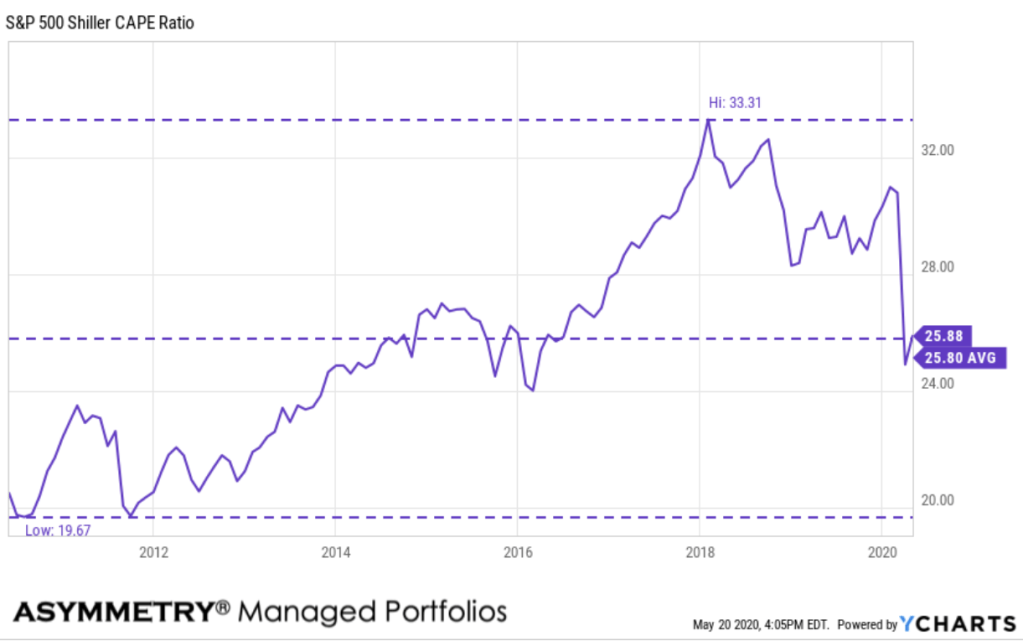
Before March, I had been pointing out the S&P 500 was the second highest valuation going back over 140 years, according to Shiller.
The S&P 500 Shiller CAPE Ratio, also known as the Cyclically Adjusted Price-Earnings ratio, is defined as the ratio the the S&P 500’s current price divided by the 10-year moving average of inflation-adjusted earnings. The metric was invented by American economist Robert Shiller and has become a popular way to understand long-term stock market valuations. It is used as a valuation metric to forecast future returns, where a higher CAPE ratio could reflect lower returns over the next couple of decades, whereas a lower CAPE ratio could reflect higher returns over the next couple of decades, as the ratio reverts back to the mean.
Even after the S&P 500 stock index declined -34%, the S&P 500 Shiller CAPE Ratio is at a current level of 25.88, down from its 33.31 high in January 2018, but far from an undervalued level. In fact, it has so far just reverted to its 10 year average.
Long term bull markets have historically started at low levels, like 10. Bull markets historically end at high valuation levels, such as around 20. It’s far from a science and not a good market timing indicator. But, it helps us to understand the big picture risks/rewards. From a high starting point, we shouldn’t expect to see high capital gains from passive indexing.
Here is S&P 500 Shiller CAPE Ratio going back before 1900 to put it into context.

Even though the price to earnings ratio has fallen as the price fell, it isn’t anywhere near what we consider undervalued.
So, it is what it is.
If this is the early stage of a bigger bear market, it has plenty of room to fall before become “undervalued” and this may explain why
On Twitter today was some concern about the famous value investor Warren Buffett isn’t buying stocks. Instead, he’s selling stocks.
“Is it meaningful that Buffett has $137 billion in cash and $40 billion yearly in cash flows to deploy in Berkshire $BRK.B and he’s worried it might not be enough?”
Buffett is famous for buying stocks when others are panicking. But, he isn’t, et. The simple answer is the stock market in general remains at 25 times earnings by the Shiller measure, and it reached the lower teens in March 2009 and single digits before that before another secular bull market occurred.
Prices have to reach a low enough level to attract buying demand. As of now, we’re seeing it happened in March, considering the gains since the March 23rd low.
But, it looks like prices may have to fall a lot more before big value investors like Buffett get more invested.
An investment manager like me has much more flexibility. I’m far more quick and nimble, so I can make tactical decisions and then change my mind with liquidity.
If no buyers are willing and able to enthusiastically buy the stocks and bonds we’re selling, especially because we have to much of it, then;
oops.
Semper Gumby.
Always Flexible.
Mike Shell is the Founder and Chief Investment Officer of Shell Capital Management, LLC, and the portfolio manager of ASYMMETRY® Global Tactical. Mike Shell and Shell Capital Management, LLC is a registered investment advisor focused on asymmetric risk-reward and absolute return strategies and provides investment advice and portfolio management only to clients with a signed and executed investment management agreement. The observations shared on this website are for general information only and should not be construed as advice to buy or sell any security. Securities reflected are not intended to represent any client holdings or any recommendations made by the firm. Any opinions expressed may change as subsequent conditions change. Do not make any investment decisions based on such information as it is subject to change. Investing involves risk, including the potential loss of principal an investor must be willing to bear. Past performance is no guarantee of future results. All information and data are deemed reliable but is not guaranteed and should be independently verified. The presence of this website on the Internet shall in no direct or indirect way raise an implication that Shell Capital Management, LLC is offering to sell or soliciting to sell advisory services to residents of any state in which the firm is not registered as an investment advisor. The views and opinions expressed in ASYMMETRY® Observations are those of the authors and do not necessarily reflect a position of Shell Capital Management, LLC. The use of this website is subject to its terms and conditions.

You must be logged in to post a comment.