Until the recent breakout to new highs, the stock and bond markets have made little progress in the past two years. Below are the price trend and total return chart of the S&P 500 stock index (SPX). The price trend of SPX has trended in a range of 20% to 30% since the first of 2018, but until this month, it had made very little progress.

The price return through today is 7.45%, and the total return, including dividends, is 11.38%. At the end of October, it was only 5.73% and 9.5%.
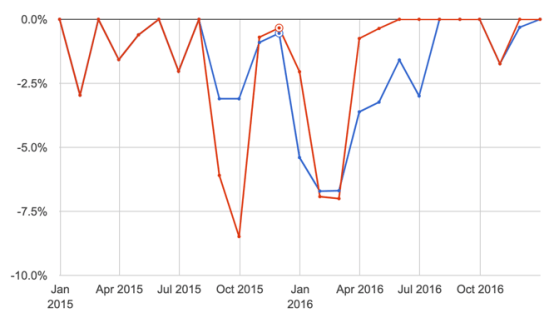
So, this has been a long non-trending volatile period similar to 2015 and 2016. From January 2015 to November 2016, the percent change of the SPX was near zero. Finally, in December, it trended up and broke out to a new uptrend. Still, over two years, the price trend change was only 8.74%.

I define market trends as volatile and non-volatile, trending, and non-trending. When we understand the current condition, it helps with tactical decisions of which type of system to focus on.
When markets are trending, and quiet, directional trend following systems enjoy the ride.
When a market gets choppy and volatile, the trend following systems have difficulty as they may exit the lows only to miss out on the price trend reversal back up. Then, by the time they reenter, the trend reverses back own again. A straightforward observation is the 200-day moving average, which got whipsawed several times in the 2015 to 2016 period.

I don’t trade moving averages. But, if we did over this period by entering the signal above the moving average and entered/exited at the close the day it was crossed, we’d have experienced these whipsaws. Of course, just thinking back to the past isn’t nearly as exciting as experiencing market action in real-time.
But, applying the moving average would have resulted in approximately -2.2% in 2015 vs. a small gain of 1.25% in the SPX.
In 2016 executing the signals resulted in a gain of 8% vs. 12 for the SPX.
Only looking at the upside leaves out the downside we have to experience to achieve it. Below are the drawdowns of this method applied to the stock index (blue line) vs. the stock index itself (red line.) This simplified example using a moving average for trend following missed most of the first decline with a drawdown of only -3% when the SPX dropped -8%, but then it participated in the next decline. Also notice it took a while to regain exposure, so it “missed out” of the sharp uptrend reversal April 2016 to July.
When it’s one sharp declined after an uptrend, trend following methods usually exit and avoid some loss. It’s when the price swings up and down over a period we see the whipsaws of non-profitable entries and exits.
Over the past two decades, I’ve spent a lot more time and resources studying what causes entry and exit systems to fail than data mining for those that were historically successful. My heavy emphasis on what doesn’t work helped me to discover what does. Of course, this isn’t an example of a method that doesn’t work just because it didn’t achieve a perfect result of a hostile period. The other side of its results over this period was the smaller drawdown. To many investors, it’s worth missing some upside if the downside is limited.
If we want to manage the downside loss, we must be willing to miss some upside gain as there is no free lunch in active risk management.
These periods that are hostile for some methods signaled for me to have other weapons in the arsenal. For example, while trend following methods can do well in trending, non-volatile markets by catching the trend and riding it to the end, my countertrend systems are shorter-term and aim to enter and exit the swings. So, my countertrend systems actually consider the swings a friendly condition as they want to enter the shorter term countertrends down and exit to take a profit after it trends up.
Applying both of these systems is a bit of a shell game. But hey, that’s my name, so it may as well be my game. I say it’s a shell game because trend following and countertrend systems are in direct conflict with each other, so we necessarily need to decide which to use, when. It’s another tactical decision. It requires me to determine which market condition we’re observing and then apply the method that seems to best fit the situation. Nothing is ever perfect, and it’s far from easy, but when executed well, we have the potential to take advantage of different conditions. Or, more importantly, to avoid the hostile conditions of the single strategy.
It’s all easier said than done.
I have spent much effort in developing systems and skills for the execution of them. I am well aware of the challenges I face. But, I embrace the challenges, accept them, and deal with them.
By the way, the same 200-day moving average trend following method once again had its share of whipsaws since the beginning of 2018.

So, anyone applying trend following like this is happy to see the new breakout and hoping it will continue. If it doesn’t, the moving average exit signal is about -6% below the current price, so it would result in a -6% drawdown if the price falls from this point.
My countertrend systems, on the other hand, are signaling a short-term exit for this same stock index and entries on sectors like Utilities and Real Estate. You can see why in the chart.
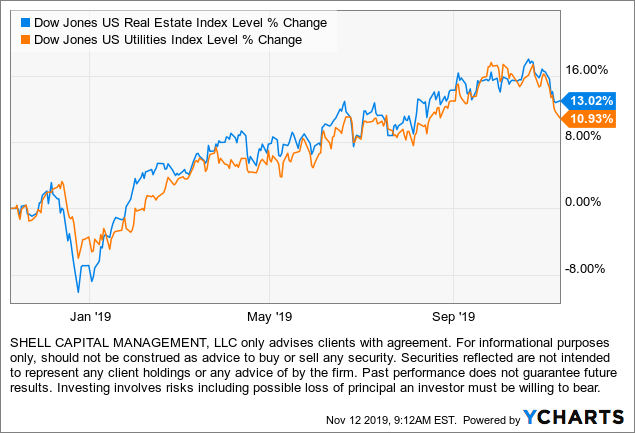
They are in an overall uptrend, but their prices have dropped recently, offering a potentially asymmetric risk/reward if the uptrend resumes back up. That is, the downside is limited by predefining an exit if they continue to fall, but it’s more probable they may reverse back up and continue their uptrends. If they do, it becomes a trend-following trade. Of course, the indexes cannot be invested in directly, and this isn’t advice, but an example of how a countertrend system may look.
So, the bottom line is this has been a non-trending, very volatile two years for U.S. stocks and it’s a state that is hostile for simple directional trend following methods. If the recent breakout to the upside continues, the market state shifts to trending and maybe less volatile, but as I pointed out in Quantitative trend and technical analysis indicators signal strong U.S. equity participation in the uptrend but it may be nearing exhaustion it seems more likely we’ll see some countertrend or at least a stall even though this is a historically seasonably strong period.
The trick is to be prepared for whatever may happen next, and I am.
Mike Shell is the Founder and Chief Investment Officer of Shell Capital Management, LLC, and the portfolio manager of ASYMMETRY® Global Tactical.
Mike Shell and Shell Capital Management, LLC is a registered investment advisor focused on asymmetric risk-reward and absolute return strategies and provides investment advice and portfolio management only to clients with a signed and executed investment management agreement. The observations shared on this website are for general information only and should not be construed as advice to buy or sell any security. Securities reflected are not intended to represent any client holdings or any recommendations made by the firm. Any opinions expressed may change as subsequent conditions change. Do not make any investment decisions based on such information as it is subject to change. Investing involves risk, including the potential loss of principal an investor must be willing to bear. Past performance is no guarantee of future results. All information and data are deemed reliable but is not guaranteed and should be independently verified. The presence of this website on the Internet shall in no direct or indirect way raise an implication that Shell Capital Management, LLC is offering to sell or soliciting to sell advisory services to residents of any state in which the firm is not registered as an investment advisor. The use of this website is subject to its terms and conditions.

You must be logged in to post a comment.