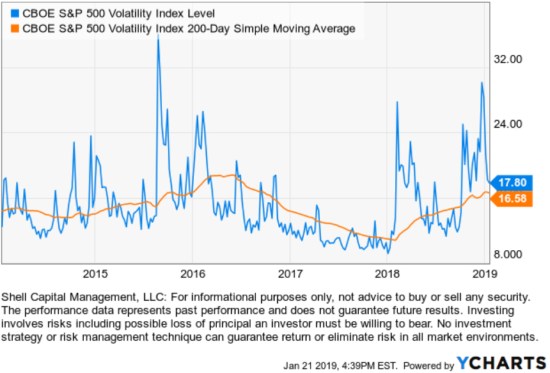
Last week I shared the observation that VIX Implied Volatility is Settling Down. The VIX Index is a measure of the market’s expectation of future volatility, so the market is pricing in less volatility from here.
However, looking over the past five years, we can apply the 200-day simple moving average to the VIX to see vol oscillate between low vol regimes and a volatility expansion. Currently, it’s still somewhat a volatility expansion in comparison to recent periods, though the 17.80 level is below the long term average of 20. Everything is relative and evolving, so it depends on how we look at it.
Growing up on a small farm in East Tennessee I learned to “make hay while the sun shines.” Disasters happen if we try to make hay all the time or at the wrong time. I know many investors have a passive, all in, all the time approach, but I also saw farmers try to make hay in harsh weather. We have a better experience if we plan to make hay when the sun is shining rather than during a thunderstorm.
I believe the timing is everything.
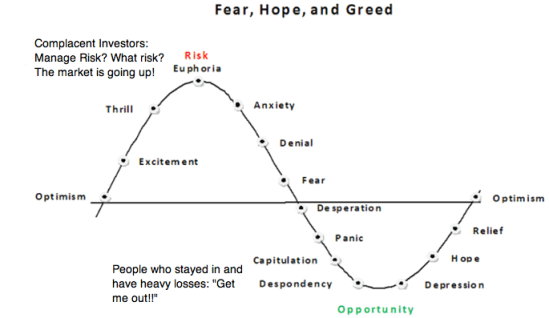
Markets, especially stocks, are not normally distributed. We observe waterfall declines far beyond what is seen within a normal bell curve. These “tail risks” shock investors and cause panic selling. As panic selling drives prices lower, it results in more panic selling. Unfortunately, most investors natural inclination is to do the wrong thing at the wrong time. So, we see them getting too optimistic at peaks like January 2018 and then panic at lower prices like December 2018.
If I am to have better results, I must necessarily be seeing, believing, and doing something very different than most people. In fact, what I’m doing should appear wrong to them when I’m doing it. So, to do the right thing overall, I must necessarily appear wrong to most when I’m doing it. That’s what I do, and I’m not afraid to do it. I just do what I do, over and over, and if someone doesn’t like it, they don’t have to ride in our boat.
I occasionally share a glimpse of the many indicators that generate signals that help to inform me. Most of these indicators I share aren’t actual trade signals to buy or sell, but instead, I use them for situational awareness. I don’t want to be one of the people in the above chart. I prefer to instead reverse it. If I’m going to experience any feelings, I want to feel greed when others are in a panic and feel fear when others are euphoric. That’s how I roll at the extremes. More often, we are in a period between those extremes when I just want to be along for the ride.
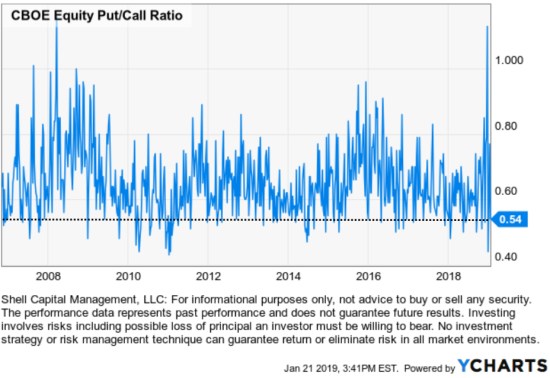
In several observations recently like An exhaustive analysis of the U.S. stock market on December 23rd, I covered the Put/Call Ratios and other indicators because they had spiked to extreme levels. In some cases, like the CBOE Total Put/Call Ratio spiked to 1.82 in late December, which is its highest put volume over call volume ratio ever.
A put-call ratio of 1 signals symmetry: the number of buyers of calls is the same as the number of buyers for puts. However, since most individual stock investors buy calls rather than puts the ratio of 1 is not an accurate level to gauge investor sentiment. The long term average put-call ratio of 0.7 for the Equity Put/Call Ratio is the base level I apply. Currently, the Equity Put/Call Ratio is back down to 0.54, which indicates a bullish investor sentiment. A falling Put/Call ratio below its longer-term average suggests a bullish sentiment because options traders are buying a lot more calls than puts. In fact, it’s a little extreme on the bullish side now. I wouldn’t be surprised to see the stock market decline some and this level trend back up.
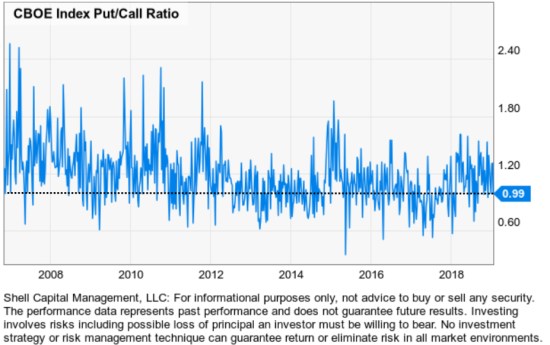
The Index Put/Call Ratio is often greater than one because the S&P 500 index options are commonly used by professional investment managers to hedge market risk. At 0.99 I consider this to signal there isn’t a lot of hedging right now so I wouldn’t be surprised to see stocks pull back some and the ratio trend up more. It isn’t an extreme bullish sentiment, but maybe a little complacent.
So, in just about four weeks we’ve seen the sentiment of investors swing from one extreme back within a more normal range. I can’t say the current levels are extreme enough to be any significant signal, but they are drifting that way. Investors currently see this is a “risk on” regime, so we’ll go with the flow until it changes. By these measures and others, we are seeing them approach a level to become more aware of an elevating potential for a counter-trend.
The good news is, none of this has to be perfect. Asymmetric risk-reward doesn’t require a 100% win ratio, it’s about the average gain exceeding the average loss. For me, it’s more about magnitude than probability.
Mike Shell is the Founder and Chief Investment Officer of Shell Capital Management, LLC, and the portfolio manager of ASYMMETRY® Global Tactical.
The observations shared on this website are for general information only and are not specific advice, research, or buy or sell recommendations for any individual. Investing involves risk including the potential loss of principal an investor must be willing to bear. Past performance is no guarantee of future results. The presence of this website on the Internet shall in no direct or indirect way raise an implication that Shell Capital Management, LLC is offering to sell or soliciting to sell advisory services to residents of any state in which the firm is not registered as an investment advisor. Use of this website is subject to its terms and conditions.

You must be logged in to post a comment.