In “Relative Strength can be a source of conflict for Tactical Traders” I explained how two different momentum indicators are in conflict with each other and can lead to conflict in tactical trading decisions. Tactical traders may use many different indicators and methods to determine whether to enter, hold, or exit a position. If we look at two conflicting indicators like this, we have to avoid becoming conflicted ourselves.
To avoid the conflicts, define clearly what they are and how to use them. To do that, I’m going to mix up a bowl of Physics and Psychology.
The indicators essentially represent the same thing. They apply a different algorithm, but both are momentum measures that determine the speed of change in price movements. A key difference is that the basic Relative Strength I used is a simple price change over a period. That simple Relative Strength algorithm simply compares the price change over a period to determine which trends are stronger and which are weaker. Tactical Traders using this method of Relative Strength expect the stronger trends will continue to be stronger and the weaker trends will continue to be weaker. A trend in motion is expected to continue in that direction until some inertia comes along and changes it. You may recognize this from Physics:
Newton’s first law of motion states that “An object at rest stays at rest and an object in motion stays in motion with the same speed and in the same direction unless acted upon by an unbalanced force.” Objects tend to “keep on doing what they’re doing.” In fact, it is the natural tendency of objects to resist changes in their state of motion. This tendency to resist changes in their state of motion is described as inertia.
Inertia: the resistance an object has to a change in its state of motion.
We can say the same about investor behavior and beliefs when we look at confirmation bias.
Confirmation bias is the tendency to search for, interpret, favor, and recall information in a way that confirms one’s preexisting beliefs or hypotheses.
That psychological bias is similar to the physics law of motion;
“Objects tend to keep on doing what they’re doing. In fact, it is the natural tendency of objects to resist changes in their state of motion.”
Investor and trader behavior and Confirmation Bias seems to agree with the first law of motion.
You can probably see how we may develop our beliefs because of our environment. If we observe over time the natural tendency of objects to resist changes in their state of motion then we may expect a trend to continue.
It gets more interesting. According to The Physics Classroom:
Newton’s conception of inertia stood in direct opposition to more popular conceptions about motion. The dominant thought prior to Newton’s day was that it was the natural tendency of objects to come to a rest position. Moving objects, so it was believed, would eventually stop moving; a force was necessary to keep an object moving. But if left to itself, a moving object would eventually come to rest and an object at rest would stay at rest; thus, the idea that dominated people’s thinking for nearly 2000 years prior to Newton was that it was the natural tendency of all objects to assume a rest position.
So, up until Newton’s first law of motion, people believed trends would eventually end instead of continue. In that same way, some people look for and expect recent price trends to change rather than continue.
We have discovered two different beliefs.
- A trend in motion will stay in motion with the same speed and direction (unless acted upon by an unbalanced force).
- A trend will eventually stop moving (a force is necessary to keep an object moving).
A Tactical Trader using Relative Strength based on the rate of change assumes that trend speed and direction will continue into the future. This is more in agreement with Newton’s first law.
A Tactical Trader using the Relative Strength Indicator, an oscillator, assumes that trend speed and direction will oscillate between a range. If it reaches “oversold” it may reverse back up and if it reaches “overbought” it may reverse back down. This is more like the Physics beliefs prior to Newton’s first law when they expected a trend or motion to change.
To avoid conflicts between these two concepts and indicators, I define them separately as Trend Following and Countertrend.
Trend Following systems are methods that aim to buy securities that are rising and sell securities that are declining. Trend following is directional – it focuses on the direction of prices. Not all measures of Relative Strength are directional, but the one I used is. I simply ranked the sectors based on their price change over 3 months. That is an absolute ranking, but also a relative ranking. I may require the price change to be positive to enter a position. Some Relative Strength methods are only relative, so they don’t require a positive trend. They may enter the sectors that have a better price change over the period even if it’s negative.
Countertrend systems aim to bet against the recent price trend for the purpose of pursuing a capital gain or for hedging. In a strongly rising market, a countertrend strategy may believe the price is more likely to reverse. For example, the RSI is “overbought.” In a declining market, a countertrend strategy may indicate the trend is likely to reverse back up. For example, RSI is “oversold.” The risk is, an oversold market can keep trending lower and an overbought market may keep trending up!
I believe there are directional trends that are more likely to continue than to reverse – so I apply Trend Following to them. That necessarily means I believe investors may underreact to new information causing the price trend to drift gradually over time to match supply and demand.
I also believe that trends can reach an extreme, especially in the short run, by overreacting to information or extremes in sentiments like fear and greed. Because I have observed trends reaching an extreme, I may apply overbought and oversold methods for countertrend trading.
When I see the chart below, I think:
“The trend is up, it has moved up fast enough to be overbought in the short term, so it may pull back some and then the trend may resume to the upside”.
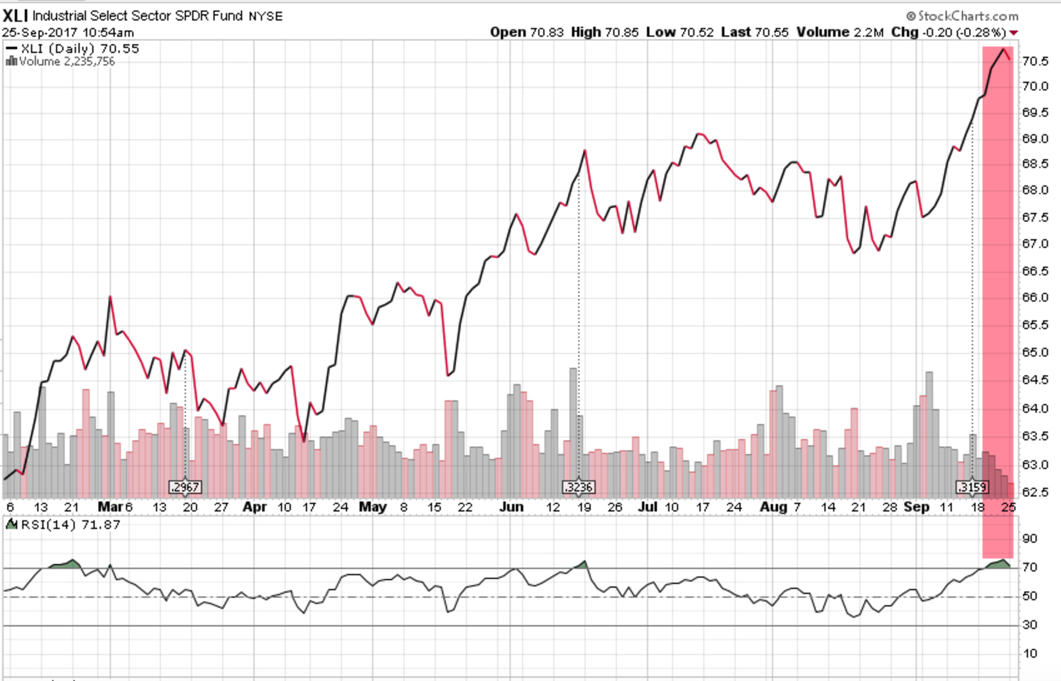
I combine the two, rather than them necessarily being in conflict with each other. I believe the high RSI number is confirming the strong trend, but I also believe it suggests it may not be the best entry point if you care about entering a position that may decline a few percent after you enter it.
So, I believe both of these systems can be applied at different times depending on the market state of the trend type. When a price trend is oscillating up and down over time but not necessarily making a major new high or low, a Countertrend method may capture profits from those swings. When a trend is moving up or down for a prolonged period that same Countertrend system may catch some of the profits and miss some as well. That is because it expects the trend to reverse at certain points and it doesn’t. However, a Trend Following system may better capture the overall trend when it keeps trending. But, none of them are perfect. If a Trend Following system captures the bigger trend it also means it will likely participate in a drawdown when the trend does end. If the Trend Following algorithm is loose enough to ride the trend without whipsaws, it will also be loose enough to lose some gains when the trend does change to the other direction.
If Tactical Traders and investors have useful definitions like these and can apply these different methods to different types of markets, with the right mindset and expectations we can avoid the conflicts.
Mike Shell is the Founder and Chief Investment Officer of Shell Capital Management, LLC, and the portfolio manager of ASYMMETRY® Global Tactical.
The observations shared on this website are for general information only and are not specific advice, research, or buy or sell recommendations for any individual. Investing involves risk including the potential loss of principal an investor must be willing to bear. Past performance is no guarantee of future results. The presence of this website on the Internet shall in no direct or indirect way raise an implication that Shell Capital Management, LLC is offering to sell or soliciting to sell advisory services to residents of any state in which the firm is not registered as an investment advisor. Use of this website is subject to its terms and conditions.

Pingback: Relative Strength can be a source of conflict for Tactical Traders « ASYMMETRY® Observations
Pingback: Industrial Sector Pulling Back as RSI Suggested it Could « ASYMMETRY® Observations