Relative Strength can be a source of conflict for Tactical Traders. I was talking to another tactical trader who manages a hedge fund. He said:
“Industrials are a leading sector, but it’s overbought”.
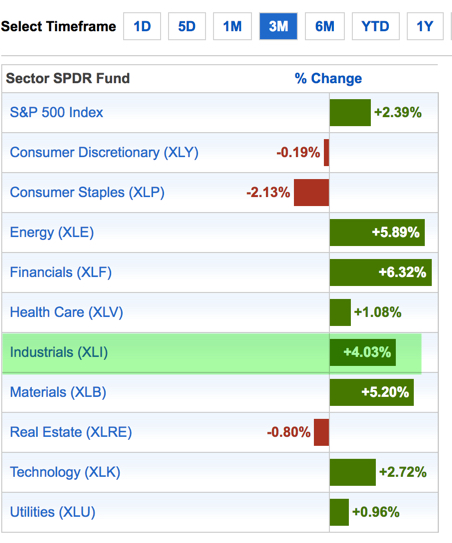
Relative Strength is a simple measurement to determine which stock, sector, or market has trended up the most over a period of time. For example, when we rank U.S. sectors over a period of 3 months to see which sectors have been trending the strongest, we see sectors like Financials, Energy, Materials, and Industrials have been the leaders over the past three months. Of course, past performance doesn’t necessarily indicate it will continue into the future. As with any trend indicator, Relative Strength is always looking at the past, never the unknowable future.
To see a different visual, below is how those same sectors appear in a line chart over the past 3 months. We observe that most of the sectors have trended in a wide range over the past few months.
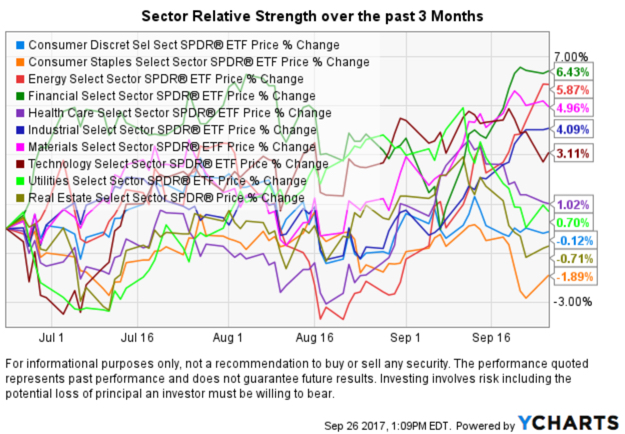
When ranked by Relative Strength, the Industrial Sector is a leader compared to other sectors and its directional trend can also be seen in its price chart.
No, wait.
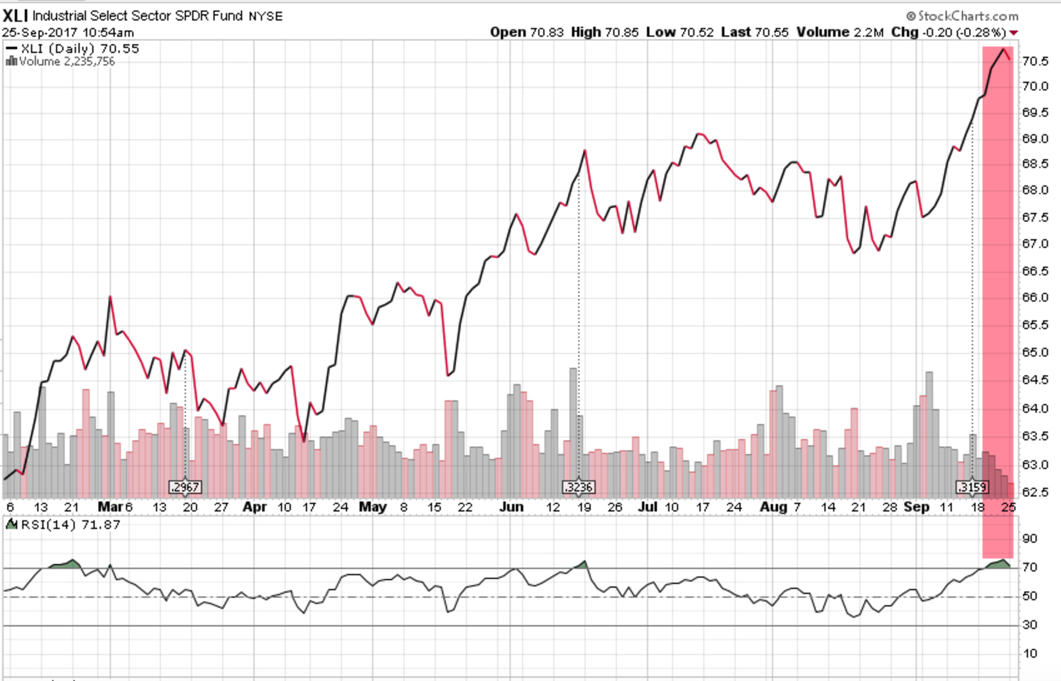
Now that I’ve pulled the chart up: The Industrial sector is overbought right now based on the Relative Strength Index. I highlighted the indicator over 70 with the red line.
So, one “Relative Strength” indicator says it’s in a strong relative trend, the other suggests its “overbought”.
These two indicators sound the same, but they are different, but also the same. It depends on what you think it represents. Both of them actually represent the same thing, but the expectation from them is the opposite.
Relative Strength as I used above, is just a simple comparison of the price trends over the past 3 months, or whatever time frame you want to use.
The Relative Strength Index is a momentum oscillator that measures the speed and change of price movements. That doesn’t sound much different than Relative Strength. The equation is different. The way it is used is different. RSI oscillates between zero and 100. The default time frame is only 14 days. Without writing a book on it, I’ll share that RSI is intended to capture the shorter term swings in a price trend. Since it’s using 14 days, it’s assuming a cycle of 28 days.
When the RSI exceeds 70 it’s considered “overbought” because, mathematically, it has moved a little too far, too fast. When it gets “overbought” it’s expected to either drift sideways for some time or reverse back down. We may indeed observe the price trend stalling at overbought levels. The trouble is, it isn’t perfect. A strong trending price with a lot of inertia can continue trending up and just get more and more overbought. I find that investors who pay a lot of attention to it are concerned their profit will be erased, so they are looking to take profits when it appears overbought.
When the RSI declines below 30 it’s considered “oversold” because, mathematically, it has moved down a little too far, too fast. When it gets “oversold” it’s expected to either drift sideways for some time or reverse back up. We may indeed observe the price trend stalling at oversold levels. The trouble is, a waterfall declining price trend with a lot of inertia like panic can continue trending down and just get more and more oversold. Buying oversold markets, sectors, or stocks can lead to profits, but it’s like catching a falling knife. When I buy oversold markets, I focus on the high dividend yield positions whos yield gets higher as the price falls.
Tactical traders use many different indicators and methods to determine whether to enter, hold, or exit a position. If we look at two conflicting indicators like this, we have to avoid becoming conflicted ourselves. Many tactical traders may experience Confirmation Bias, looking for an indicator that agrees with what they already believe.
So, let’s look at that chart again. On the one hand, it’s trending up! On the other hand, it’s overbought! Will the trend continue or will it reverse down?
We don’t know, but different tactical traders use different methods to enter, hold, and exit positions. I know tactical traders who use only Relative Strength. I know others who mainly use RSI. They are buying and selling each other’s positions and both of them could be profitable overall. If you don’t like to enter a position that may decline in the weeks ahead you may want to avoid high RSI “overbought” markets if you believe they may decline in the short term. If you are a trend following purist who loves to buy new breakouts you’ll ignore the RSI and instead realize a high RSI indicators a strong trend and go for it. Said another way: do you fear missing a trend or fear losing money short term.
It’s easy to say “Don’t get conflicted and biased!” but another to shed more light on the conflict.
Tomorrow I’m going to share with you how I see it.
Stay tuned.
Read Part 2: Resolving Conflicts with Relative Strength
Mike Shell is the Founder and Chief Investment Officer of Shell Capital Management, LLC, and the portfolio manager of ASYMMETRY® Global Tactical.
The observations shared on this website are for general information only and are not specific advice, research, or buy or sell recommendations for any individual. Investing involves risk including the potential loss of principal an investor must be willing to bear. Past performance is no guarantee of future results. The presence of this website on the Internet shall in no direct or indirect way raise an implication that Shell Capital Management, LLC is offering to sell or soliciting to sell advisory services to residents of any state in which the firm is not registered as an investment advisor. Use of this website is subject to its terms and conditions.

You must be logged in to post a comment.