The risk–return trade-off is one of the most cited ideas in finance, but it’s also one of the most misunderstood. The framework correctly explains why returns exist—but it says very little about how intelligent investors structure those returns asymmetrically Read More
Category Archives: Asymmetric Observation
Risk–Return Trade-Off: Why Upside Only Exists Because Downside Does
The risk–return trade-off is one of the most widely cited ideas in investing, but it’s often misunderstood. The real lesson isn’t that more risk guarantees higher returns. It’s that meaningful returns only exist where uncertainty exists—and the intelligent investor’s task is to structure that uncertainty asymmetrically. Read More
Leverage Doesn’t Create Upside — It Amplifies Downside
When margin debt climbs to record highs, the real risk isn’t the leverage itself—it’s the forced selling that occurs when prices fall. Markets don’t decline in isolation. They decline through balance sheets. Read More
Gifts are given. Asymmetry comes from choices.
Talent may help investors understand markets, but it rarely determines outcomes. Asymmetric results come from choices—defining downside, sizing positions intentionally, and maintaining convex opportunities within a disciplined portfolio process. Read More
What Stanley Druckenmiller Actually Means by “Rate of Change” — And Why It’s the Foundation of Asymmetric Risk Management
Most investors watch price and call it analysis. More sophisticated investors watch momentum. Very few monitor the change in momentum itself — the acceleration, the second derivative, the variable that often shifts before price confirms anything. Read More
When the Hedge Stops Hedging
Many investors believe bonds protect them when equities fall. But in certain regimes, that relationship breaks down. When inflation, rates, and growth expectations pull markets in different directions, the hedge investors rely on may stop working. Read More
S&P 500: Where Asymmetric Risk Accelerates
S&P 500: Where Asymmetric Risk Accelerates
Markets don’t break gradually—they transition. The S&P 500 is approaching a key level near 6,550 where behavior shifts, volatility expands, and risk begins to compound. The difference isn’t direction—it’s what happens if you’re wrong. Read More
Heads I Win, Tails I Don’t Lose Much
This isn’t asset allocation. It’s risk allocation. Define the downside first, size positions intentionally, and structure portfolios so upside can expand while losses remain contained. Read More
The Three Dimensions of Risk — And How We Engineer Around Them
Risk isn’t a single score — it’s the interaction between risk tolerance, risk required, and risk capacity. At Shell Capital, we engineer portfolios by aligning psychological comfort, return objectives, and financial absorption ability to create durable asymmetric risk/reward structures across market regimes. Read More
When the Cycle Is Intact but the Margin of Safety Is Gone
Markets rarely break because of the headline everyone is watching. They tend to correct when valuations are stretched, liquidity tightens, and investors are positioned for the best outcome. That combination creates a fragile environment where downside risk expands faster than upside potential. Read More
The Fed Meeting Isn’t the Only Thing Markets Are Watching This Week
This week’s Fed meeting will dominate headlines. But markets often move less because of Powell’s words and more because of liquidity conditions—bank reserves, Treasury flows, and the availability of capital to buy risk assets. Understanding that distinction matters when managing portfolios through changing regimes. Read More
The World’s Economy Runs Through a 21-Mile Bottleneck
The global economy looks diversified. In reality, enormous economic flow passes through a few narrow geographic chokepoints. The Strait of Hormuz—just 21 miles wide—moves roughly 20% of the world’s oil supply, showing how small structural nodes can transmit outsized financial risk. Read More
Optionality Is An Edge Behind Asymmetric Payoffs
The crowd isn’t competing with Wall Street because it’s smarter. It’s competing because it doesn’t have to play every month. Optionality itself is asymmetric. Read More
The AI Cycle Is Shifting From Training to Inference
AI’s first wave was about training massive models. The next wave is about running them continuously. Nvidia’s push into inference infrastructure suggests the AI cycle may be shifting from episodic training bursts to persistent deployment across the economy. Read More
The Hidden Risk in a Portfolio That Looks Diversified
A portfolio can hold dozens of funds and still have a single dominant exposure. The hidden risk in many “diversified” portfolios is that the underlying return driver is the same. Read More
Asymmetric Warfare and Asymmetric Markets
Modern conflicts are asymmetric by design. Markets respond the same way. When pressure concentrates in energy, volatility, and risk premia, capital with consequences requires defined downside and intentional convexity — not prediction. Read More
The Most Dangerous Assumption Is the Old World Still Exists
Ray Dalio argues the post-1945 world order is breaking down. The real risk isn’t war tomorrow—it’s building portfolios for a world that no longer exists. Read More
Why High Income Isn’t Financial Freedom
Exit planning isn’t about retirement — it’s the rotation event that moves business owners from effort-based income to capital-driven freedom. This ASYMMETRY® Observation explains why selling a business is only the beginning, and how engineered risk management keeps owners off the treadmill for good. Read More
Where Wealth Quietly Breaks
A market crash isn’t the only cause of wealth management failures. It fails because systems weren’t built for decision pressure. This ASYMMETRY® Observation explains where wealth quietly breaks—long before a sale of a business or medical practice, death, lawsuit, or market shock forces irreversible choices. Read More
The Most Dangerous Asset Is Optimism
Markets don’t top on bad news. They top on good news that’s fully believed. The real risk at peak optimism isn’t volatility — it’s deploying meaningful capital into consensus when upside is already priced and downside remains open. Read More
Valuation Doesn’t Predict Returns. It Changes the Shape of Risk
Valuation doesn’t predict market returns. It reveals fragility. When expectations rise across sectors, portfolio structure matters more than forecasts. Read More
The Asymmetry Between Knowing and Winning
If more information was the answer, then we’d all be billionaires with perfect abs.” Derek Sivers nailed the problem. Outcomes don’t improve because you know more. They improve because your structure survives stress, error, and bad decisions. An ASYMMETRY® Observation on why more information doesn’t lead to better results. Structure, incentives, and process—not insight—determine asymmetric outcomes in investing and life. Read More
Noah didn’t wait for the flood to build the ark, and neither should your investment portfolio.
Noah didn’t wait for the flood to build the ark. Resilient portfolios aren’t constructed during drawdowns—they’re engineered in calm markets through defined downside, intentional sizing, and measured portfolio heat. Asymmetry is built before stress arrives, not after. Read More
The Most Crowded Trade No One’s Talking About: Being Fully Invested
U.S. equity mutual fund cash balances are near historic lows. When cash disappears from the system, optionality disappears with it—changing how markets behave, how risk compounds, and why downside becomes more dangerous than most investors expect. Read More
When Enthusiasm Crowds One Side of the Boat
Retail risk appetite has reached the 95th percentile, according to Citadel Securities’ order flow data. Extremes in positioning don’t predict timing, but they do change the distribution of potential outcomes — and the structure of asymmetric risk/reward. Read More
The Market Can’t Hide Its Nervous System
Price can trend higher while fear remains embedded beneath the surface. When volatility refuses to confirm a rally, the divergence between price and positioning becomes the real signal — and the real source of asymmetric risk and opportunity. Read More
Getting Off The Treadmill Isn’t About Income. It’s About Control.
Financial freedom isn’t about income levels—it’s about control. This ASYMMETRY® Observation reframes the classic four-quadrant model as levels of dependency, resilience, and optionality, showing why getting off the treadmill is a risk-management decision, not a lifestyle one. Read More
Quantitative Rules-Based Trading Systems Don’t Remove the Emotion
Why claims of “emotionless investing” misunderstand risk, behavior, and asymmetry—and why real edge comes from structure, not psychology. Investment systems don’t remove emotion. They expose it. The real edge isn’t feeling less—it’s designing a structure where emotion can’t quietly distort risk, sizing, or exits when it matters most. Read More
Valuation Extremes and the Compression of Asymmetry
Valuation is not a timing signal. It is a distribution signal. When starting points are stretched, expected forward returns compress and downside asymmetry expands. The discipline is structural, not predictive. Read More
Asymmetry vs. Velocity in Gold and Silver
Gold and silver are expressing very different forms of asymmetry. Gold reflects slow-moving structural convexity tied to policy risk, while silver’s explosive moves are driven by liquidity squeezes and regulatory uncertainty. The opportunity isn’t prediction — it’s understanding the risk geometry. Read it here: Asymmetry vs. Velocity in Gold and Silver
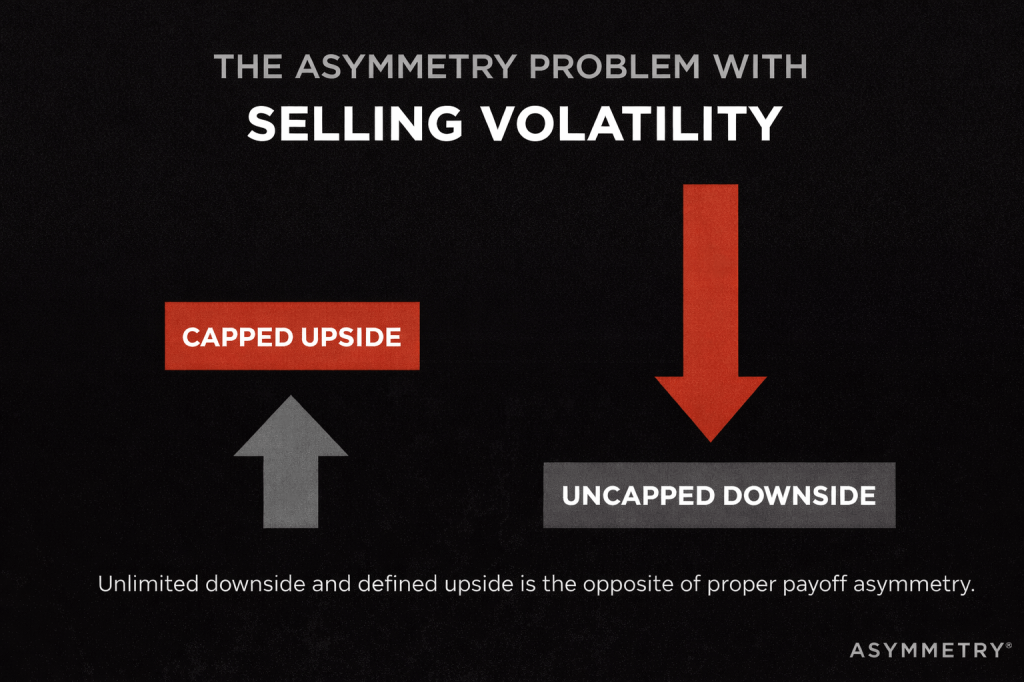
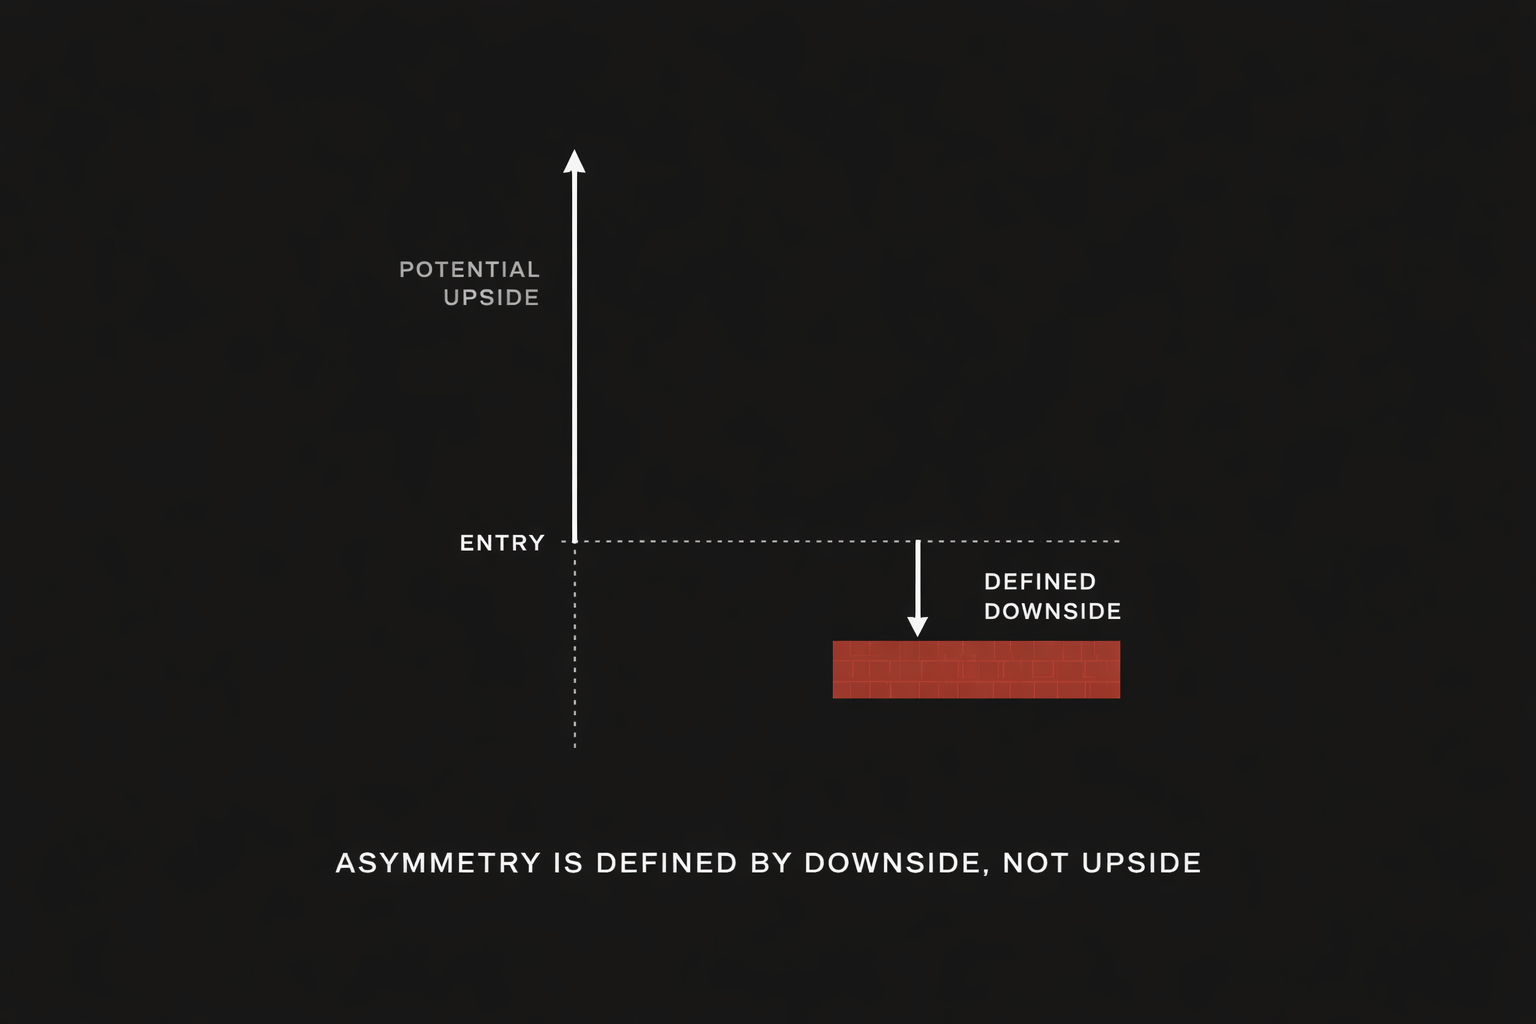
Asymmetry Is Defined by Downside, Not Upside
Asymmetry in investing is often misunderstood as large upside potential. In reality, true asymmetric risk/reward is defined by controlled downside, not imagined gains. Without a clearly defined loss, upside narratives are irrelevant because unbounded risk dominates long-term outcomes. Asymmetry begins with survival. Read here: Asymmetry Is Defined by Downside, Not Upside
Engineering Bitcoin into an Asymmetric Risk/Reward Investment and Managing Cryptocurrency Risk
Following up on Why Bitcoin Itself Lacks Asymmetric Risk/Reward, we go into more detail with an example in Engineering Bitcoin into an Asymmetric Risk/Reward Investment and Managing Cryptocurrency Risk
Why Bitcoin Itself Lacks Asymmetric Risk/Reward
Does the cryptocurrency Bitcoin offer an asymmetric risk/reward payoff? Find out: Why Bitcoin Itself Lacks Asymmetric Risk/Reward
Are We Entering a Civil War?
That question isn’t being asked because of headlines or rhetoric. It’s being asked because something more structural is changing beneath the surface.
History shows that societies don’t move directly from polarization to violence. They move through a late-cycle phase where internal conflict escalates, trust erodes, and institutions lose their ability to absorb disagreement without breaking something important.
That phase doesn’t guarantee collapse.
But it does change the geometry of risk.
When internal conflict rises, outcomes stop being symmetrical. Stability becomes conditional. Small shocks produce outsized reactions. And assumptions built during long periods of calm begin to fail.
The real risk isn’t predicting the worst-case scenario.
It’s remaining structurally exposed as the distribution of outcomes widens.
Read it here: Are We Entering a Civil War? Or Entering the Phase That Precedes It?
Investors vs. Traders
In asymmetric investing, the difference between an investor and a trader is misunderstood. Read about it in Investors Own Capital. We Actively Manage Exposure
People Earn Money in One Business — Then Lose It in Another
Why many professionals and business owners earn wealth in one business—then lose it in another. An ASYMMETRY® Observation on exit risk, capital redeployment, and asymmetric risk management. Read it: People Often Earn Money in One Business — Then Lose It in Another
The Art of Asymmetric Investing: When Imbalance Beats Balance
The Art of Asymmetric Investing: When Imbalance Beats Balance. Most investors think the goal is balance. Balanced portfolios. Balanced risk. Balanced returns. What business owner wants to balance their profit and loss? What investor wants to balance their risk and reward? Read it here: The Art of Asymmetric Investing Isn’t Balance — It’s Survival
Connecting the Dots Means Understanding How Markets Interact With Each Other
Markets don’t move in isolation. They interact. Equities, rates, volatility, options, and liquidity form a system where pressure in one area transmits into others. Understanding those interactions—who is forced to act, when risk accelerates, and where fragility builds—matters far more than predicting the next market move. Connecting the dots isn’t about forecasting outcomes. It’s about understanding how risk flows through the system—and structuring portfolios so downside is defined while upside remains open. Read it here: Connecting the Dots Means Understanding How Markets Interact
True Asymmetry vs. False Asymmetry in Investment Management
Many strategies look asymmetric—until volatility exposes what was hidden. True asymmetry starts with defined risk and leaves upside open. The difference is geometry, not storytelling. Read: True Asymmetry vs. False Asymmetry in Investment Management
Captain Condor Blowup and the Illusion of Asymmetry
Having traded options for thirty years, I’ve seen the same pattern repeat across decades and market regimes: what looks like consistency is often just risk being deferred. A strategy can look disciplined, consistent, and “low risk” right up until the moment it isn’t. The Captain Condor $50 million collapse wasn’t caused by a market crash or bad luck — it was caused by a hidden asymmetry in the risk itself. This observation explains how smooth returns, high win rates, and “defined risk” trades can still produce catastrophic outcomes when portfolio risk is left undefined — and why true asymmetry always starts with survival, not consistency. Read the observation: Captain Condor Blowup and the Illusion of Asymmetry
The Asymmetry of Alpha vs. Survival
Nassim Nicholas Taleb argues that most so-called “alpha” isn’t real because it ignores the most important variable in investing: survival through time. Strategies that look impressive based on historical averages often conceal a small probability of catastrophic loss. For investors compounding wealth over decades—especially after a liquidity event like selling a business or retirement—those rare losses matter far more than smooth long-term averages. True alpha must endure volatility, uncertainty, and adverse regimes without risking permanent capital impairment.
Read the full article on the Shell Capital blog:
Why Nassim Nicholas Taleb Says Most “Alpha” Isn’t Real
https://shell-capital.com/asymmetry-observations/why-nassim-nicholas-taleb-says-most-alpha-isnt-real
Markets aren’t driven by averages

This observation was originally published at Shell Capital’s ASYMMETRY® Observations.
Markets aren’t driven by averages
Most investment frameworks still assume markets are driven by rational actors optimizing long-term averages.
They aren’t.
Markets are driven by how humans perceive gains, losses, and risk in real time—and that perception is systematically distorted under pressure.
This isn’t speculation. It’s formalized in Prospect Theory, the Nobel Prize-winning framework developed by Daniel Kahneman and Amos Tversky that explains how people actually behave when real money is on the line.
The asymmetry is structural
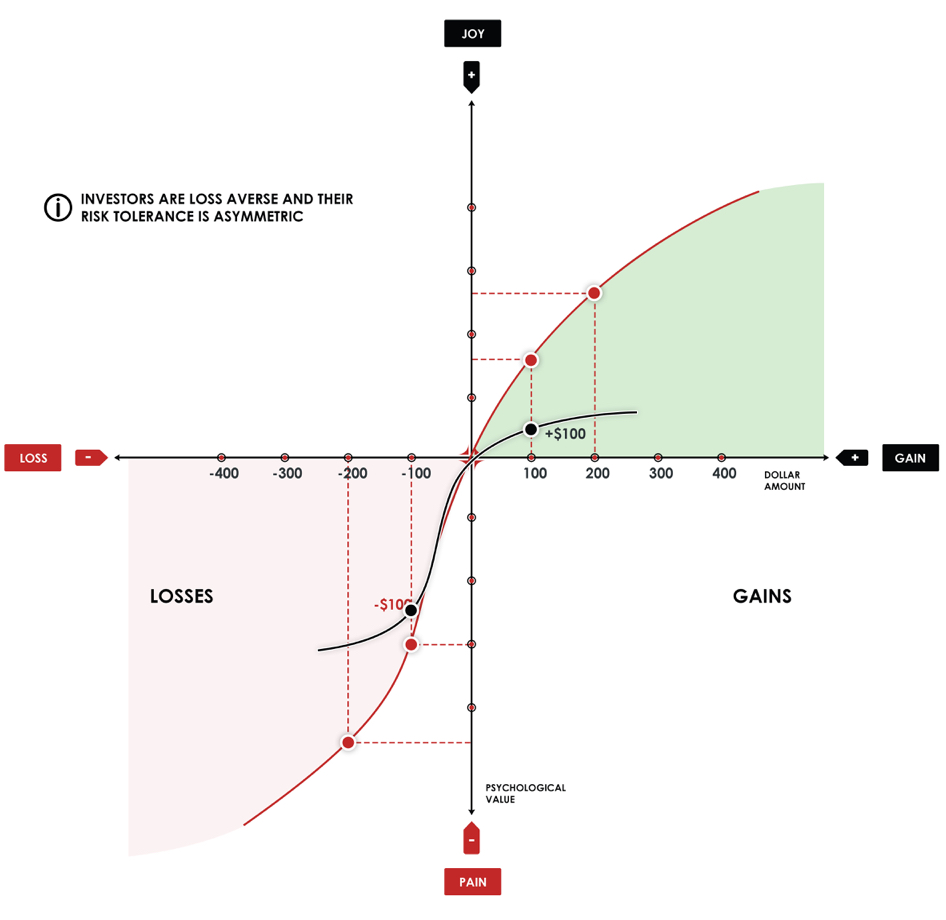
Prospect Theory demonstrates investors are:
- Risk-averse when they’re winning
- Risk-seeking when they’re losing
- Far more sensitive to losses than to equivalent gains
This creates a non-linear value function centered around a reference point—usually “break-even.”
In markets, that behavioral asymmetry shows up as:
- Upside trends that persist longer than expected
- Downside moves that accelerate faster than models assume
- Volatility that clusters rather than distributes smoothly
Averages don’t explain that. Behavior does.
Where wealth gets destroyed
Here’s the problem most investors don’t see coming:
The gap between how portfolios are constructed and how humans actually behave under pressure is where wealth gets destroyed.
Not by market risk. By behavioral risk.
Modern Portfolio Theory assumes you’ll hold through any drawdown. Prospect Theory explains why you won’t—and why trying to force yourself to will likely make things worse.
Loss aversion intensifies as drawdowns deepen. Investors lock in gains too early when winning and hold losses too long trying to “get back to even.” The discipline you think you have evaporates precisely when you need it most.
That’s not a character flaw. It’s human wiring.
From behavior to process
Prospect Theory doesn’t predict what markets will do next. It explains how people react once markets move.
That distinction is critical.
At Shell Capital, we design systems around that reality:
- Downside risk is defined in advance, before loss aversion takes over
- Exits to limit losses are systematic, not emotional
- Upside is allowed to compound when trends persist
- Position sizing reflects asymmetry, not averages
We don’t optimize for theoretical means. We manage the path—how returns are experienced over time.
Because the path is what determines whether you stay invested or tap out.
The practical reality
You can’t behavior-modify your way out of loss aversion. You can only design around it.
Markets aren’t driven by averages—they’re driven by how humans perceive gains, losses, and risk under pressure.
Our systems are built to harness that asymmetry while protecting against the behavioral traps that destroy even well-intended investment plans.
That’s where disciplined risk management begins.
Does your portfolio account for behavioral risk?
At best, portfolios may be stress-tested for market scenarios—2008, COVID, rate shocks.
Almost none are stress-tested for the investor.
One of the many parts of ASYMMETRY® is a behavioral risk diagnostic that maps allocations against asymmetries that emerge under pressure:
- Where loss aversion is likely to override discipline
- Which positions create unintended behavioral exposure
- How your exit strategy (or lack of one) amplifies downside risk
- Whether your position sizing reflects asymmetry or just diversification
If you want to see how your portfolio holds up under behavioral stress, contact us and we’ll send you the framework and walk you through how we apply it to your current holdings.
—Mike Shell President & Chief Investment Officer Shell Capital Management, LLC
S&P 500 Dividend Yield Hits Multi-Decade Low: What It Means for Asymmetric Investors
This observation was originally published at Shell Capital’s ASYMMETRY® Observations.
The S&P 500 dividend yield has dropped to 1.25%, one of the lowest readings in more than two decades. That’s 31% below its long-term average of 1.81% and just a hair above its historical low of 1.12%. Read it here: The S&P 500 Dividend Yield Has Collapsed—Here’s Why It Matters for Asymmetric Risk/Reward and Asymmetric Returns
Drawdown Control is Essential for Compounding Efficiency
We pursue what we refer to as “drawdown control” through individual position risk management, portfolio heat limits, and portfolio hedging for risk mitigation.
Compounding efficiency isn’t about how much we make—it’s about how much we keep compounding.
Read about it: Drawdown Control is Essential for Compounding Efficiency
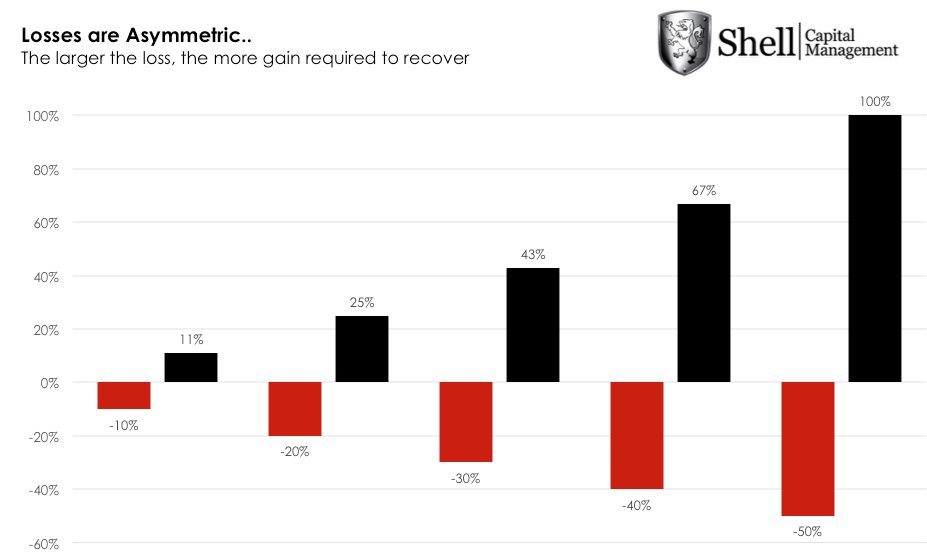
Investment Portfolio Drawdowns from Market Losses Work Geometrically Against You
Investment drawdowns from market losses work geometrically against you.
Losses don’t scale linearly—they scale exponentially in how they hurt compounding.
Read it here: Drawdowns from Market Losses Work Geometrically Against You
VIX Futures Still in Backwardation: What It Tells Us Now

VIX Futures Still in Backwardation: What This Shift Tells Us Now
The VIX futures curve continues to send a clear message: volatility remains elevated, and the market still expects it to fade—but not just yet.
Read it here: VIX Futures Still in Backwardation: What This Shift Tells Us Now
If the link doesn’t open from the email, click the title.
The Case for Limiting Drawdowns Through Active Risk Management and Hedging: The Math Behind Efficient Compounding
To compound capital efficiently over time, downside risk must be actively mitigated. The key to long-term wealth creation isn’t just capturing upside—it’s protecting capital through asymmetric risk/reward positioning and strict portfolio risk exposure limits.
Read it here: The Case for Limiting Drawdowns Through Active Risk Management and Hedging: The Math Behind Efficient Compounding
Market Breadth Collapse Intensifies: Monitoring for Countertrend Setups with Asymmetric Risk/Reward
The latest internal market data shows a broad collapse in demand and increase in selling pressure across all major S&P 500 sectors.
The percentage of stocks trading above key moving averages—from 5-day to 200-day—has declined sharply. While short-term trend damage is now widespread, we’re beginning to see conditions where countertrend setups with convexity potential may form.
It’s a signal to prepare for an eventual countertrend.
Read it here: Market Breadth Collapse Intensifies: Monitoring for Countertrend Setups with Asymmetric Risk/Reward
Asymmetry in Sector Dispersion: Q1 2025 U.S. Sector Dashboard Insights
Sector dispersion is a gift to the asymmetric investor. When sectors diverge this sharply in trend, volatility, and valuation, the environment rewards those who are willing to rotate tactically and structure trades to capture exponential upside while controlling downside risk. We may use this data to identify setups with capped downside and high upside optionality—hallmarks of true asymmetry.
Read about it here: Asymmetry in Sector Dispersion: Q1 2025 U.S. Sector Dashboard Insights

You must be logged in to post a comment.