Last week I had an interview with Barbara Kollmeyer, Senior Editor & Reporter, at MarketWatch: The Wall Street Journal Digital Network. It was then featured in Barrons this morning as “Investors Are Ignoring Two Major Risks to Stocks, Warns Fund Manager.“
It sparked some inbound questions, so I’m sharing the full interview below. I don’t always do interviews, but when I do, I prefer them in writing, so my words aren’t misinterpreted or taken out of context. Barbara asked some great questions. She also did a great job getting straight to the point and picking out what is probably the most important part for her audience of an otherwise much more broad conversation. For those who want more information and have questions, I hope you enjoy it and find it helpful.
Can you briefly explain an asymmetric portfolio, and how that has helped your clients ride out major stock market corrections?
I’ve been managing ASYMMETRY® Global Tactical for fifteen years now. I designed it to be a complete portfolio, all in one account. That is, I actively trade a global universe of stocks, bonds, and alternatives like volatility. The investment objective is a positive asymmetric return profile that fits within our client’s tolerance for risk and the desired return over a full market cycle. An asymmetric return profile means I want to actively control my downside risk while trying to capture as much of the upside I can. I believe traditional asset allocation and diversification is not enough; a smoother return profile for clients requires drawdown controls such as risk management and hedging. The hallmark of my track record has been how we got through the 2008-09 period and overall consistency. By focusing on asymmetric risk-reward, which is mainly a focus on cutting losses short and managing portfolio risk, we’ve been able to provide risk-adjusted returns to fit clients’ sensitivity for risk. So, my focus is providing asymmetric, risk-adjusted returns over full market cycles of uptrends and downtrends.
What is your biggest market call right now? How do you make money in 2020?
Periods of low volatility are followed by volatility expansions. In the short run, investor sentiment is very optimistic, which has helped drive the stock market a higher risk level of correction. I like uptrends, until the end when they bend, so I apply trend following systems. However, even an upward price trend has counter swings up and down along the way that can reach extremes. So, I also monitor for these potential countertrend signals to help smooth out the risk-reward more asymmetrically. At the moment, I’m prepared for a possible downswing that seems likely in the months ahead. As for 2020, I think we’ll see a volatility expansion off the recent calm state. The driver of a volatility expansion may be the U.S. election and other geological issues. I’ll trade the price swings and volatility.
You talk about how the stock market hasn’t made any progress in the last two years? Why is that and what will change it?
In the last two years, the stock index dropped -5 to -10% three times, which is normal, but also -20% this time last year. Until recently, when stocks started trending up, and volatility contracting, the stock indexes made little progress going back to the end of 2017. I define the period as counter trending and volatile. I believe the stock market made little upward progress because 2017 was an abnormally smooth uptrend with a 20% gain in the S&P 500 index with no drawdowns of more than 3-4%. Investors became euphoric as prices trended up and drove it to an extreme overbought level on the upside. Since then, I think we’ve seen all that excessive optimism get worked off as extreme cycles tend to swing the other way. I warned about this extensively two years ago. As to what may change it from a counter trending state to an uptrend, we see it try to trend up now, but it seems there are some headwinds such as slow earnings, relatively high valuation, and political issues. Although the market can climb a wall of worry, I’m prepared for the worst.
If we can call this the longest bull market ever, what stops it?
Yes, this is the longest bull market in American history. In 2007 I was warning of a 73-74 type bear market, and that’s what we saw. As I said in 2007, before the waterfall decline, something will get the blame for it, but it will just be the market, doing what it does. I believed the stock market was at a cyclical peak within a long term secular bear market that started in 2000. Currently, this is a very aged old bull market. It reached the second-highest valuation level in 150 years measured by Shiller PE Ratio. The only two times it was this high was Black Tuesday in October 1929 what is now known as The Wall Street Crash of 1929 and the Great Crash. In 2017 Shiller PE was higher at 33 than its 1929 peak of 30. The second period was when it hit 44 in December 1999. More experienced investors today may remember what happened next. It’s now known as the dot-com bubble, and it popped with stock indexes dropping over -50%. I don’t use PE ratios for trading or investment decisions, but my understanding of it has helped me be aware of the big picture. I’m not suggesting we will see another big crash like those that followed these high valuation periods, but instead, investors need to be aware of the risk that it could unfold the same.
What’s the biggest risk investors are ignoring right now? Do you feel that they rely too much on ETFs?
The biggest risk investors seem to be ignoring right now is the high valuation and age of this bull market and the risks it poses for the long run. It doesn’t have to fall just because it’s been trending up over a decade, but the valuation and expected return from this starting point are pretty simple. For example, the current dividend yield is now less than 2%, the PE is 30, and earnings growth is lower than decades ago. The long term expected return is a summation of these, so when we add it up, it’s maybe 4-5% from this starting point. That’s half the 10% historical return investors are told to expect, which is the average since 1924 commonly seen on a brokers wall. In 1924, the dividend yield was 5%, PE was only 10 allowing a lot of room to expand, and earnings growth was higher than it has been recently. This is the one thing I think investors need to be aware of. It’s also why I do what I do. I think we need to row, not sail, to get the results we want.
I don’t believe investors necessarily rely too much on ETFs, and I was an early ETF investor myself. I started trading ETFs two decades ago, when there were just a few, such as sectors. Passive indexing may become a market risk and lead to less price discovery, but overall, I view ETFs as a great way to gain efficient exposure to return streams. Now, if all investors do is buy and hold them, I think that will be a significant risk eventually as it was before.
What’s your favorite chart right now and why?
My favorite chart right now is the VIX, because it has trended down to the 12 range. As you can see in the chart, when implied volatility gets this low, we eventually see a volatility expansion.
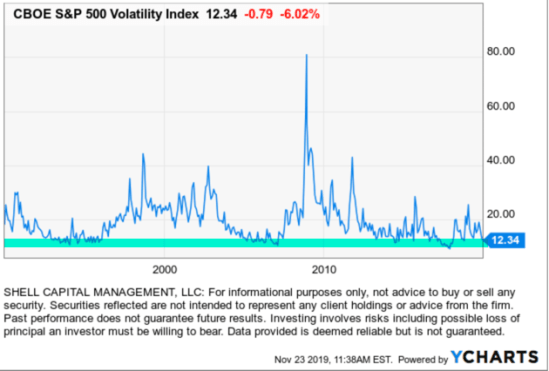
So, I’m prepared for it as it both signals to me the opportunity for a lower cost asymmetric hedge and maybe profit from rising volatility. Asymmetric risk-reward is achieved by a lower-risk entry where the risk is predefined and limited, but the payoff is higher. An asymmetric payoff, for example, is when I risk $1 and earn $2. Asymmetric risk-reward, for me, is defined by how I structure to trade, not what I invest in. But some things have a higher likelihood of trending, which can create asymmetry. Of course, as with all indexes, the VIX is not something you can invest in directly. In fact, since the VIX is a mathematical calculation, you can’t even buy a basket of the securities inside the index to mimic the VIX. Instead, the only way investors can access the VIX is through futures contracts, options, or exchange-traded funds. So, we can go “long volatility” in several different ways.
Another chart I think is worth a mention is the Alerian MLP Index. The Alerian MLP Index is a gauge of energy infrastructure Master Limited Partnerships (MLPs) whose constituents earn the majority of their cash flow from midstream activities involving energy commodities.
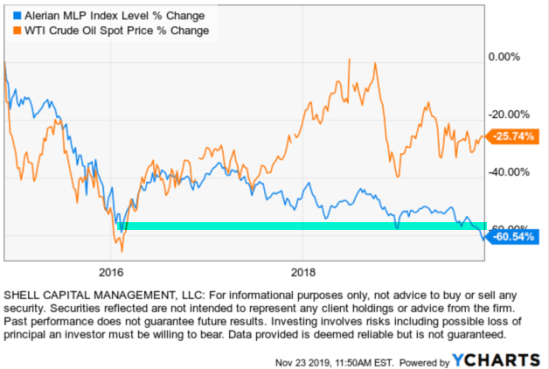
An asymmetric global macro trend been noticing recently it has trended down to a lower low that 2016 while WTI Crude Oil Spot Price is much higher than it was then. It’s an interesting divergence. Alerian MLP Index is an index, so it cannot be invested in directly but its price chart itself an example of an asymmetric risk-reward if it reverses back up. But, the current downtrend could keep trending down much lower than anyone believes it can. As such, it is essential to predetermine risk in advance. There are many things that could drive MLP prices lower, including trade deals, or lack thereof.
Barrons link: Investors Are Ignoring Two Major Risks to Stocks, Warns Fund Manager
In the spirit of ASYMMETRY® and asymmetric risk-reward payoffs, I’m naturally trying to get the most reward for the efforts as possible, so share it!
Mike Shell is the Founder and Chief Investment Officer of Shell Capital Management, LLC, and the portfolio manager of ASYMMETRY® Global Tactical.
Mike Shell and Shell Capital Management, LLC is a registered investment advisor focused on asymmetric risk-reward and absolute return strategies and provides investment advice and portfolio management only to clients with a signed and executed investment management agreement. The observations shared on this website are for general information only and should not be construed as advice to buy or sell any security. Securities reflected are not intended to represent any client holdings or any recommendations made by the firm. Any opinions expressed may change as subsequent conditions change. Do not make any investment decisions based on such information as it is subject to change. Investing involves risk, including the potential loss of principal an investor must be willing to bear. Past performance is no guarantee of future results. All information and data are deemed reliable but is not guaranteed and should be independently verified. The presence of this website on the Internet shall in no direct or indirect way raise an implication that Shell Capital Management, LLC is offering to sell or soliciting to sell advisory services to residents of any state in which the firm is not registered as an investment advisor. The use of this website is subject to its terms and conditions.

You must be logged in to post a comment.