“October. This is one of the peculiarly dangerous months to speculate in stocks. The others are July, January, September, April, November, May, March, June, December, August, and February.” – Mark Twain
I’m not a fan of “seasonality” for use with tactical decisions… but if when it’s considered along with other issues like investor complacency and an overvalued stock market it can be more interesting.
Seasonality is a characteristic in the data experiences regular changes that seem to recur every calendar year. Any change or pattern in a time series that recurs or repeats over a one-year period can be said to be “seasonal”.
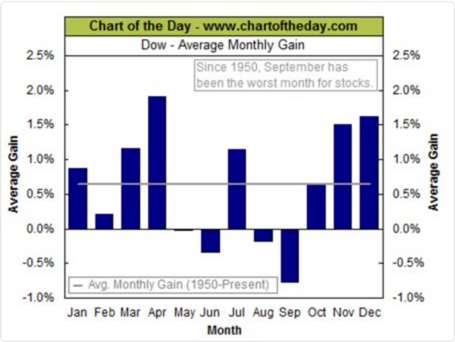
I don’t expect these seasonal patterns to always play out. However, the average gain or loss over a 66 year period can be statistically significant. It’s just not a “sure thing” – but nothing ever is. The fact is, the chart below does illustrate the mathematical expectation for the expected return for each month based on the past 66 years. If the average return for a month is down nearly -1%, then that is the expectation. But it’s based on the “average” of the sample size; it says nothing about the probability or magnitude of outliers. The bottom line is: it will not always play out this way because the probability of an event is the measure of the chance that the event will occur.
Since 1950, U.S. stocks are often weak May to October and then a counter-trend rise occurs in July.
Then comes September…
Chart of the Day shows worst calendar month for stock market performance over the past 66 years has been September…
We’ll see…
Source: http://www.chartoftheday.com/20160831.htm?H
If you are like-minded, believe what we believe, and want investment management,contact us. This is not investment advice. If you need individualized advice please contact us or your advisor. Please see Terms and Conditions for additional disclosures.

Pingback: Investors Were Indeed Complacent… « Asymmetry Observations