The CBOE Volatility Index® (VIX® Index®) is a key measure of market expectations of near-term volatility conveyed by S&P 500 stock index option prices. Since its introduction in 1993, theVIX® Index has been considered by many to be the world’s premier barometer of investor sentiment and market volatility.
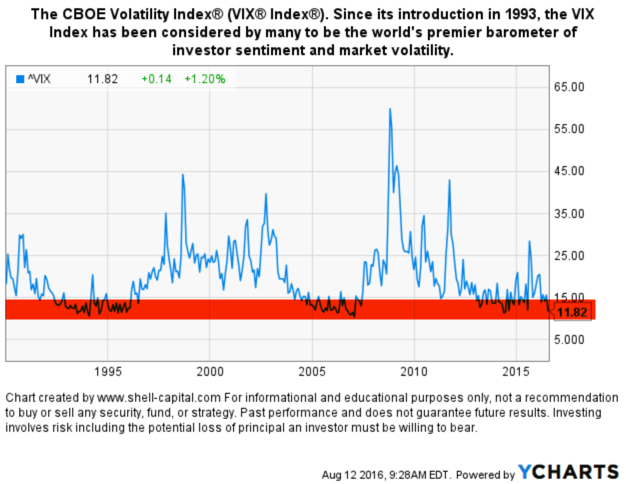
The VIX® historically trends between a long-term range. An extreme level of the VIX® will likely reverse … eventually. The chart below we show the price level of the VIX® since its inception in 1993. We can visually observe its long-term average is around 20, but (I highlighted in red) its low range is around 12 and it has historically spiked as high as 25 or 60.
The CBOE Volatility Index® is an index that cannot be invested in directly, however, there are futures, options, and ETN’s that attempt to track it. Its level is commonly used as a gauge of investor sentiment. An extremely high level of the VIX® means that options traders are paying high premiums for options because they are fearful of future volatility and maybe lower stock prices. Options traders and investors are buying options to hedge their portfolios and their demand drives up the “insurance premium”.
Just the opposite is the driver of an extremely low level of the VIX® like we see today. It means that options traders are paying low premiums for options because they are not so fearful of future volatility and lower stock prices. They are unlikely buying options for hedging and their low demand drives down the “insurance premium”. We could also say “investors are complacent” since they aren’t expecting future volatility to increase or be higher.
These levels of complacency often precede falling stock markets and then rising volatility. When stock prices fall, volatility spikes up as investors suddenly react to their losses in value. Or, in the short term volatility could trend even lower and reach an even more extreme low level for a while. But the VIX® isn’t an index that trends for many years in one direction. Instead, as we see in the above chart, the VIX® oscillates between a low and high range so can expect it to eventually trend the other way.
We shouldn’t be surprised to see at least some short-term trend reversals; maybe stocks trend down and the VIX® trends up…
We’ll see…
There is much more to the VIX® , such as it’s term structure, but the scope of this article is to point out its extreme low level could be an indication of future change.
If you are like-minded, believe what we believe, and want investment management, contact us. This is not investment advice. If you need individualized advice please contact us or your advisor. Please see Terms and Conditions for additional disclosures.

You must be logged in to post a comment.