As of today, the below table illustrates the year-to-date gains and losses for the S&P 500® Index (SPY) and the 9 Sector SPDRs in the S&P 500®. We observe the current and historical performance to see how the U.S. Sectors match up against the S&P 500 Index.
So far, the S&P 500 Index is down -5.68% year-to-date. Only the Consumer Discretionary (XLY) and Health Care (XLV) are barely positive for the year. Energy (XLE) has entered into its own bear market. Materials (XLB) and Utilities (XLU) are in double-digit declines.
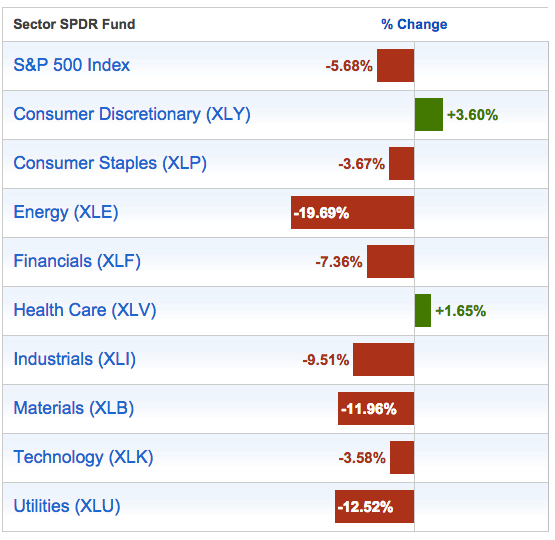
Source: http://www.sectorspdr.com/sectorspdr/tools/sector-tracker
The trouble with a table like the one above is it fails to show us the path the return streams took along the way. To see that. below we observe the actual price trends of each sector. Not necessarily to point out any individual trend, but we can clearly see Energy (XLE) has been a bear market. I also drew a red line marking the 0% year-to-date so point out that much of this year the sectors have oscillated above and below it and most are well below it now.
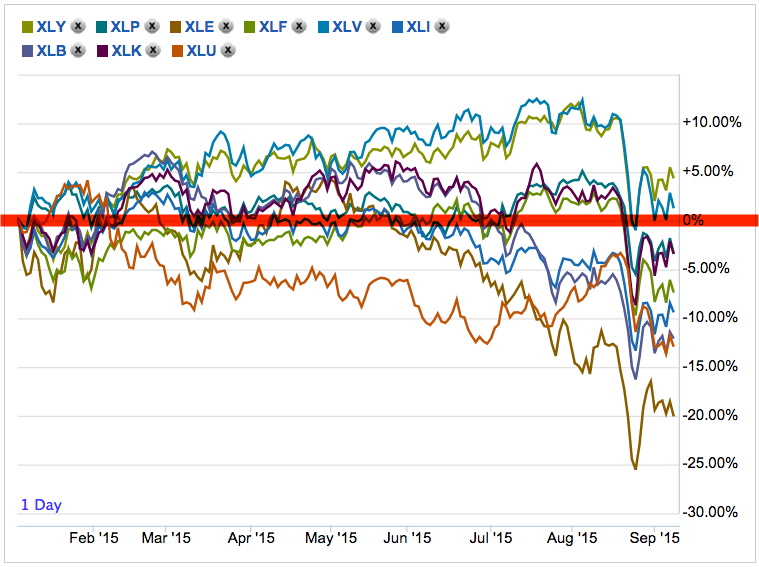
Source: http://www.sectorspdr.com/sectorspdr/tools/sector-tracker
Speaking of directional price trends is always in the past, never the future. There are no future trends, today. We can only observe past trends. In fact, a trend is today or some time in the past vs. some other time in the past. In this case, we are looking at today vs. the beginning of 2015. It’s an arbitrary time frame, but still interesting to stop and look to see what is going on.
As many global and U.S. markets have been declining, you can probably see why I think it’s important to manage, direct, limit, and control exposure to loss. Though, not everyone does it well as it isn’t a sure thing…

You must be logged in to post a comment.