 I actually wrote this at 1pm but wanted to wait to publish it after the close to see if the pattern I observed at 1pm would be intact at the close. It wasn’t, but I decided to publish this anyway and add an additional point: there is real information in price action and it doesn’t have to be perfect, especially if there is additional confirming information. These candlestick patterns mark potential trend reversals, but require confirmation before action anyway. Even though the close wasn’t exactly a Shooting Star, I still believe the price action suggests the same potential outcome if it is confirmed by lower prices.
Technical analysis of price trends include chart pattern recognition to determine what is likely to happen to a price trend over time. The most useful patterns are reversal patterns. Price data viewed on a chart is a visual representation of supply (selling pressure) and demand (buying pressure). Like other things, the direction of price is ultimately determined by supply of it and demand for it. When there is a greater demand for something its price will rise if supply stays the same. When demand declines, its price will fall. Buying pressure, then, is ultimately the primary driver of prices to the upside and selling pressure is what drives price down. A person with expertise and experience in price trend pattern recognition can study the charts pattern and gain an understanding of what is going on: buying or selling pressure. We can use that to define the direction of the trend and also identify probable reversals in the current trend. That is, determine the most probable price movements based on an examination of past price movements. Of course, price trends are always in the past. The only data of any kind we can ever study is past data; never future data that doesn’t yet exist.
I’m not a big supporter of most chart patterns as many of them aren’t testable quantitatively to determine their actual probability and expectation. However, as discretionary traders who do successfully trade patterns will argue: some patters are obvious enough in their message that when we’ve seen them play out 10,000 times before we realize we have a high probability outcome. But, note that it is still a probability, which implies likelihood; never a sure thing. Today I noticed a pattern for the popular S&P 500 stock index that, based on my two decades of empirical observation, I can say often precedes a reversal. But, it isn’t just the pattern itself that I note, but also some additional confirmation by a overbought reading in the Relative Strength Index (RSI). However, this pattern does require additional confirmation in the days ahead.
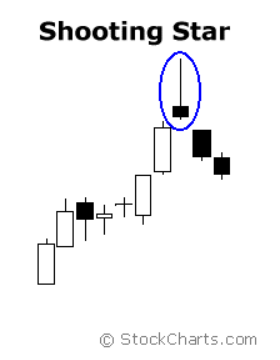
A Shooting Star is a candlestick pattern that identifies a potential trend reversal, but requires confirmation before action. It is a bearish reversal pattern that forms after an upward price trend. It occurs after the price gaps up at the open (like it did today) and then continues to move up, but then closes lower than the high of the day. I am writing this at 1pm, so it hasn’t yet closed, but I suspect this pattern is still telling. You can see what it’s supposed to look like up close in the picture above. The formation doesn’t have to be perfect or exact. A confirmation means to establish the correctness of something. Confirmation is required to validate that this pattern is a bearish reversal. The confirmation would be a gap down in price in the coming days. Until then, it is only a warning sign; a shot across the bow.
As you can see in the S&P 500 stock index price chart below, the price has been directionally trending up. It has moved about as much as it has moved in prior advances. I included the RSI indicator, which is a statistical measure that suggests the price is “overbought”. RSI is the “Relative Strength Index” that measures the speed and change of price movements. Over short time frames, like 28 days, price trends tend to exhibit mean reversion. That is, while price trends tend to continue their current trend over periods of 3- 12 months, they tend to oscillate up and down over short-term periods like a month. That is the price trend tends to peak out when the RSI reading is over 70 and bottom out when it’s closer to 30. Of course, we mainly want to follow the primary trend and looking at the chart below, that would require living with the swings of 5 -10%. If we are unwilling to deal with that, we would have to accept missing some of the gains that is required when we reduce exposure to miss some of the decline.

Source: https://stockcharts.com/h-sc/ui?s=spy
I don’t necessarily make my portfolio management decisions with these patters, but instead wanted to share this observation for those interested in understanding what I see when I observe trends unfold like this one. If nothing else, I wouldn’t be surprised to see at least a minor reversal in the price in the near future. When it does that, it may only be a 5% decline and then reverse back up to new highs again. Or, it could go on to make a lower low and be the start of a bear market. You can probably see how this is a daily and dynamic process that evolves over time requiring constant adapting to new information and changes in the current state.
Some may try to tell you that the analysis or price trends don’t work. They may say that because they themselves lack expertise or experience with it, or haven’t been successful at it. But rest assured; some of the most profitable hedge funds apply directional trend systems including pattern recognition, and trend following, all of which can be called technical or statistical analysis of price trends. If they don’t know that, they simply haven’t really studied the most successful funds in history.
In my experience I have found that those who aren’t successful applying quantitative, statistical, or chart pattern methods are people who require complete perfection. They are looking for the 100% accurate switch that doesn’t exist in anything. If it doesn’t work this time, or next, they move on rather than understanding that probability is an estimation of likelihood of occurrence of an event, not a certain outcome. Determining the probabilities and expectation is, by definition, the mathematics of an edge. Those without an edge don’t get that, and that’s why they have no edge.
