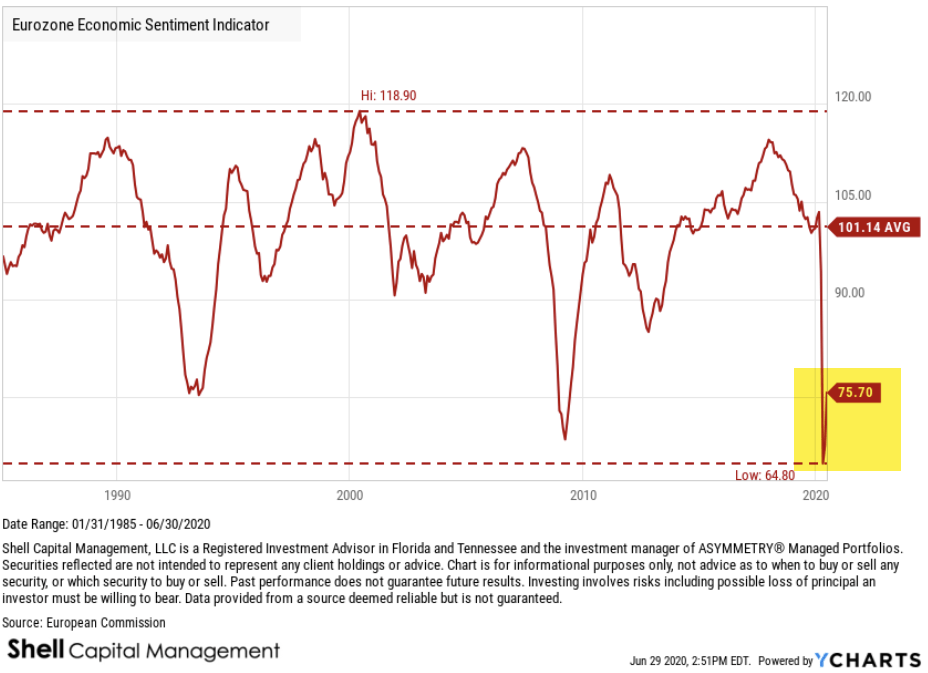
Eurozone Economic Sentiment Indicator is reversing back up off its lowest level ever at a current level of 75.70, up 12.15% from last month and -26.43% from one year ago. It’s way below average, but at least a countertrend from the extreme low reached this year.
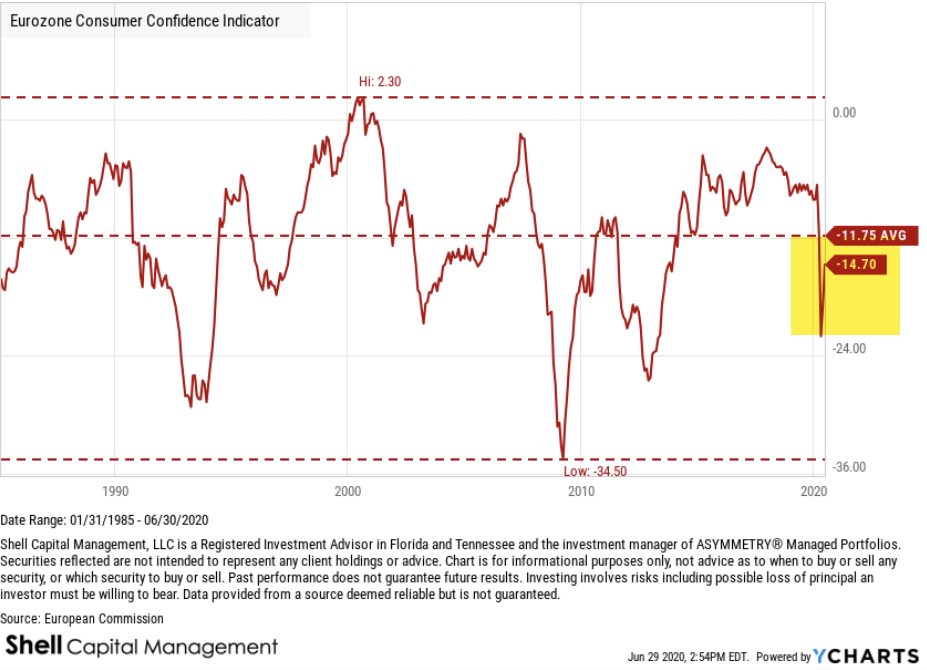
Eurozone Consumer Confidence Indicator is at a current level of -14.70, up from -18.80 last month as it has almost reverted back to its long term average.
US Pending Home Sales Month over Month is at -21.77%, compared to -20.83% last month and -1.14% last year, which is lower than the long term average of -0.03%. Pending home sales mounted a record comeback in May, seeing encouraging contract activity after two previous months of declines brought on by the coronavirus pandemic, according to the National Association of Realtors®. Every major region recorded an increase in month-over-month pending home sales transactions, while the South also experienced a year-over-year increase in pending transactions.
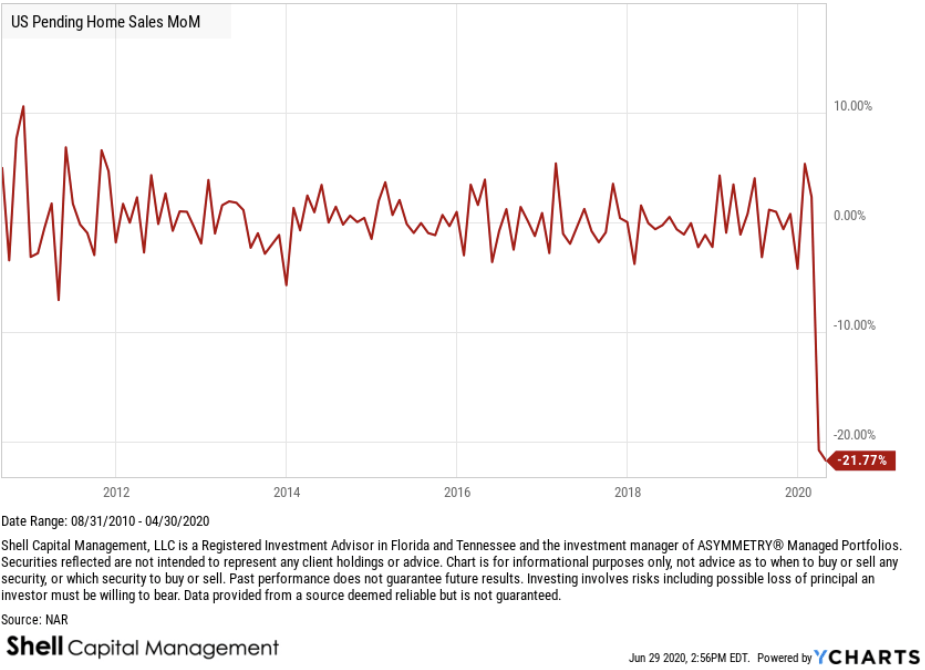
The Pending Home Sales Index (PHS), a leading indicator of housing activity, measures housing contract activity, and is based on signed real estate contracts for existing single-family homes, condos, and co-ops. Because a home goes under contract a month or two before it is sold, the Pending Home Sales Index generally leads Existing-Home Sales by a month or two.
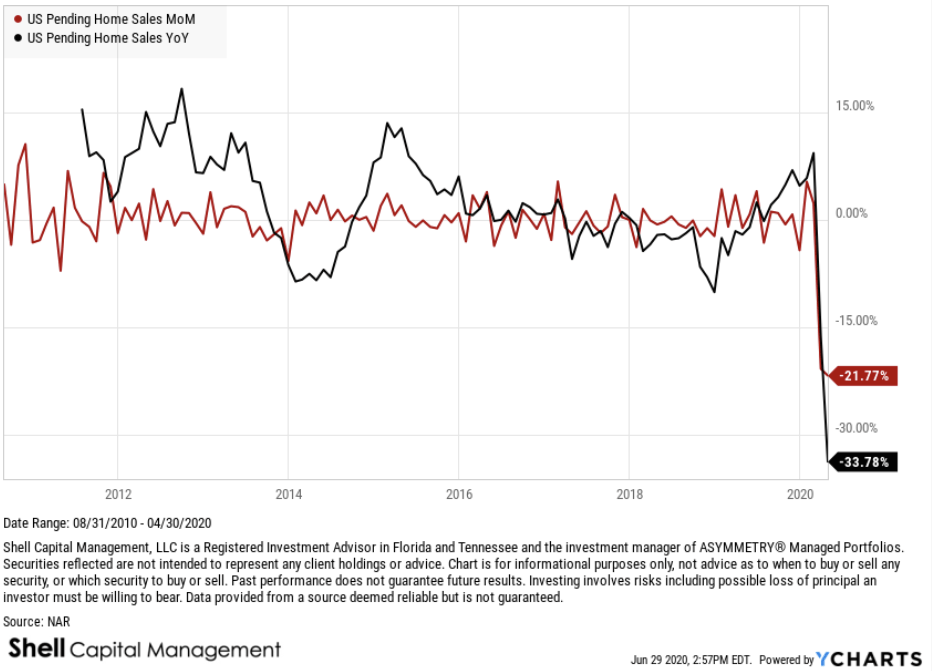
Here is the Year over year relative to Month over Month.
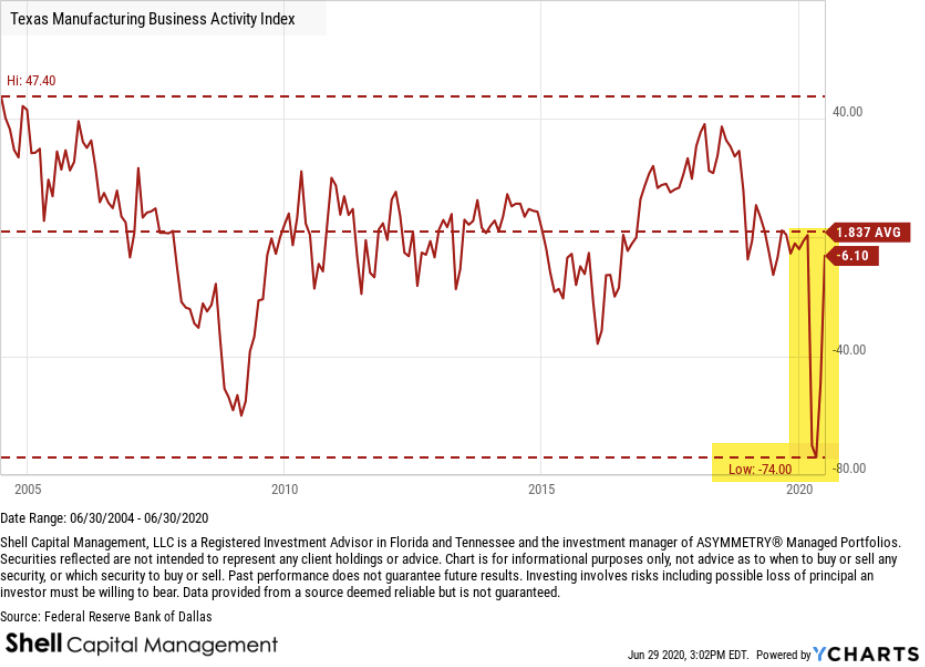
Meanwhile, in Texas… the outlook has recovered after an epic decline.
The Dallas Fed conducts the Texas Manufacturing Outlook Survey monthly to obtain a timely assessment of the state’s factory activity. Firms are asked whether output, employment, orders, prices and other indicators increased, decreased or remained unchanged over the previous month. Responses are aggregated into balance indexes where positive values generally indicate growth while negative values generally indicate contraction.
Texas Manufacturing Business Activity Index is at a current level of -6.10, UP from -49.20 last month and even UP from -12.60 one year ago.
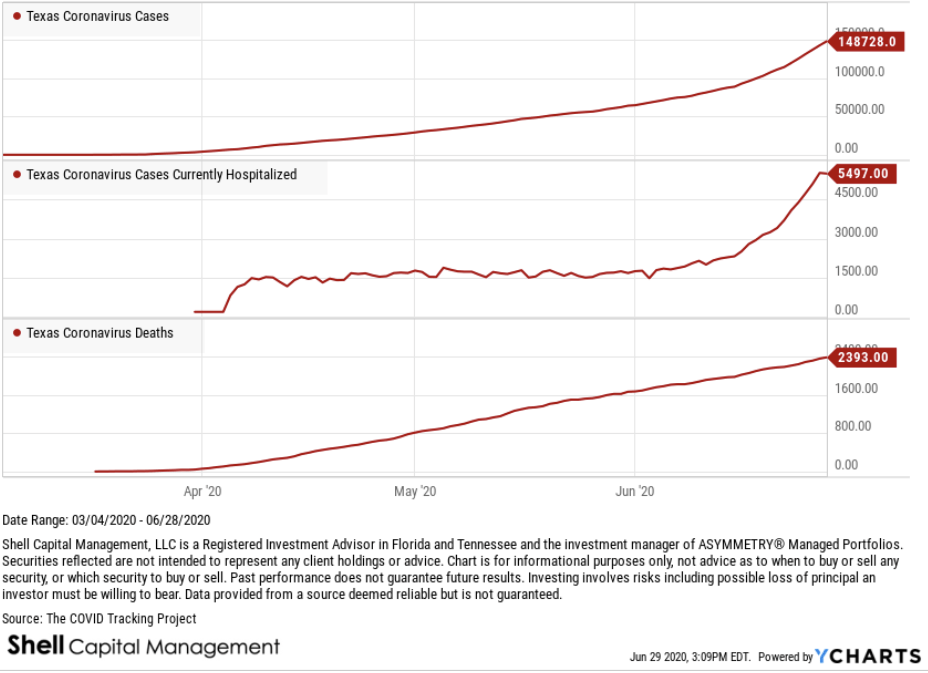
We’ll see if Texas can keep up the recovery with an uptrend in new COVID-19 cases, especially in Houston. The number currently hospitalized is at an all time high.
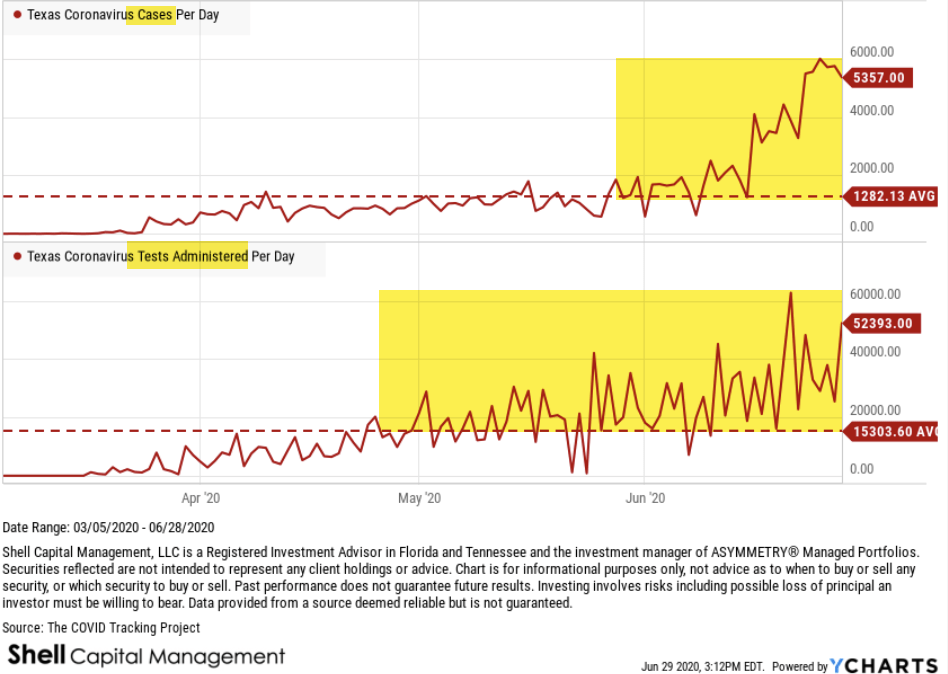
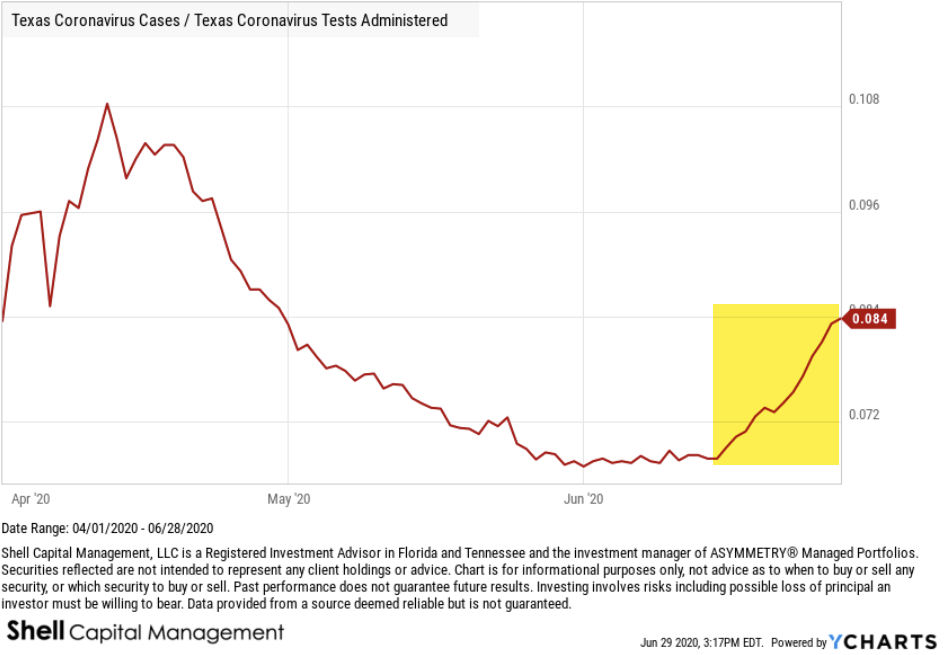
And the new uptrend in cases doesn’t seem to be driven by more testing in Texas. Although testing has trended up, it was above average about five weeks before cases were, and about eight weeks before the escalating uptrend.
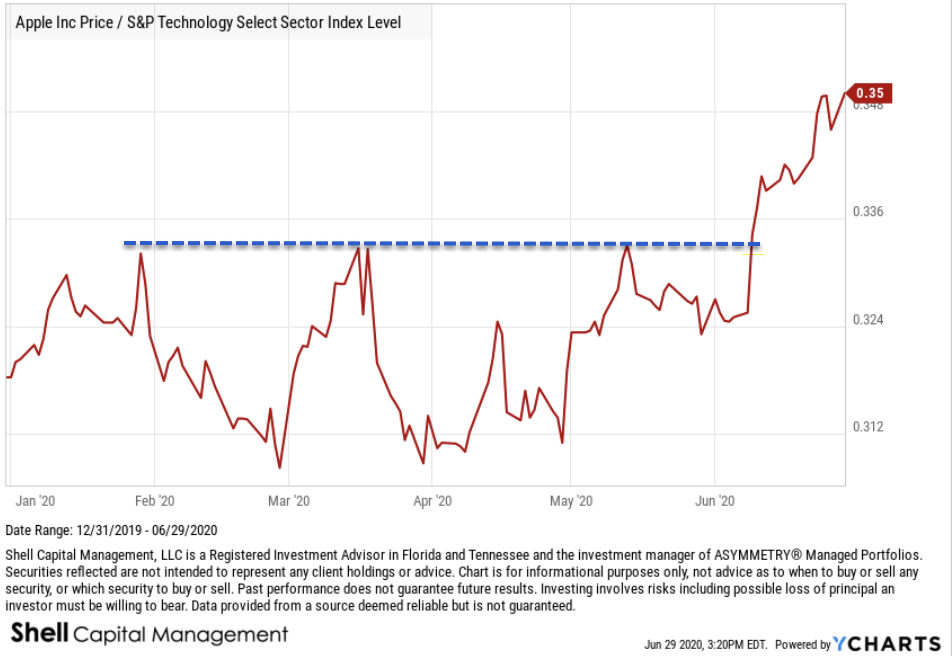
To be sure, we can apply the same relative ratio we would to a stock vs. its index. For example, Apple, Inc. (AAPL) is a top technology stock, so if we want to determine when it’s outperforming the tech sector, we compare it to the sector index. Here we see the relative momentum between them as a ratio. When the line is trending up, Apple has relative strength over the tech sector.
Below I did the same with Texas cases relative to tests administered, which shows cases have momentum over tests. Up until now, the percent of positive cases was trending down.
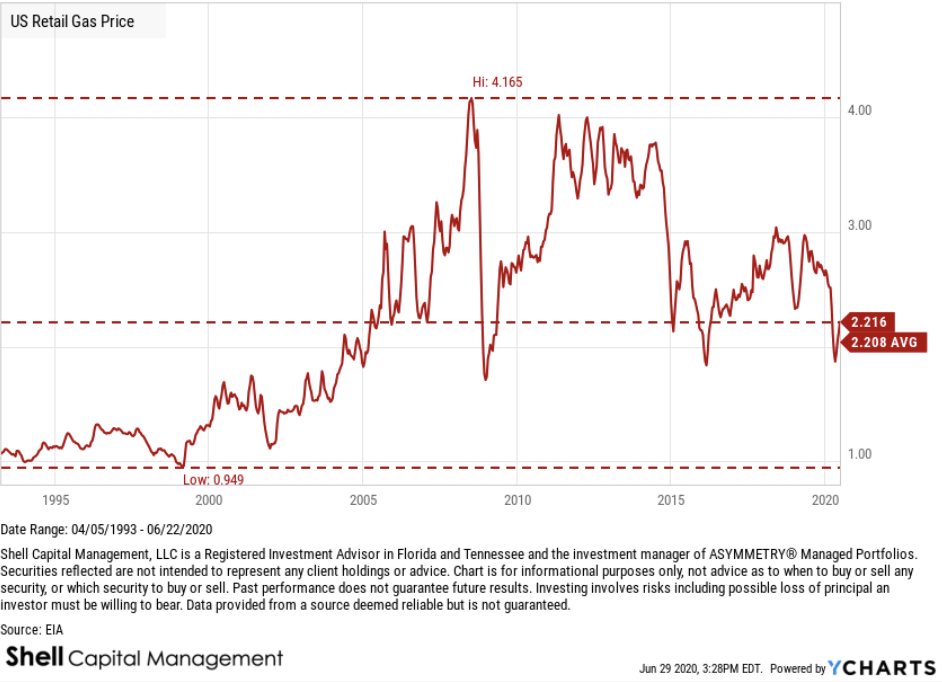
The US Retail Gas Price is the average price that retail consumers pay per gallon. Retail gas prices is good to observe to see how the energy industry is performing. Retail gas prices can give a good observation of how much discretionary income consumers might have to spend.
US Retail Gas Price is at a current level of 2.216, up 1.42% from last week and down -19.68% from one year ago. Gas reached a peak in July 2008 and then trended back up to the $4 range the summer of 2011 to the summer of 2014 before trending down again.
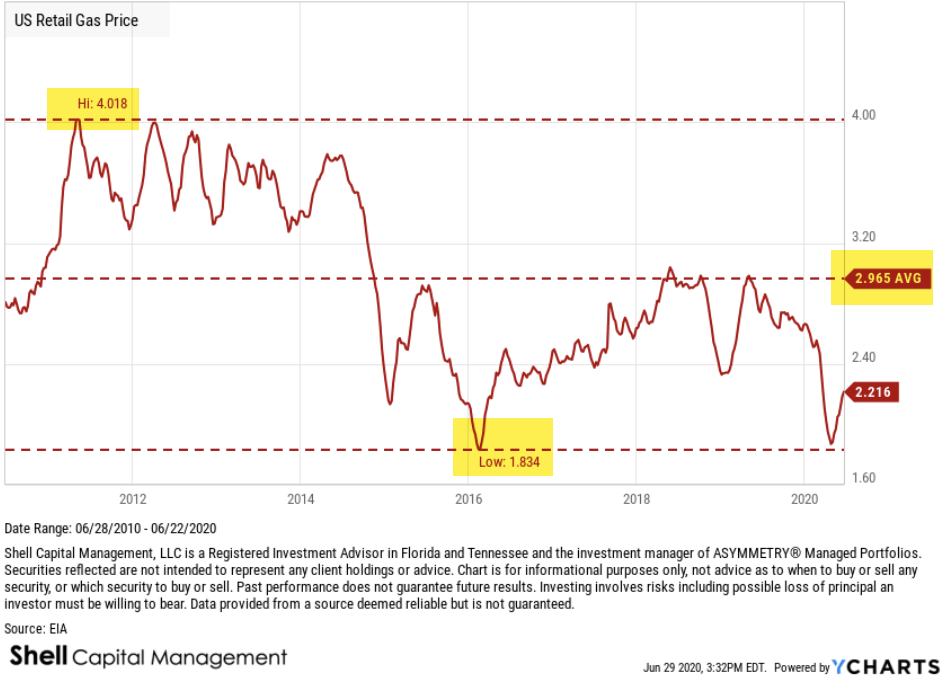
Gas has now reverted to its long term average price, which has remained elevated since 2005.
If you wondered why electric cars are still popular, it’s because the average price of gas is elevated to a new higher level. Over the past decade, gas had oscillated between $4 and $2, for an average price around $3 a gallon.
Don’t miss out! Sign up for an email of new ASYMMETRY® Observations, including some that may not be posted here.
Mike Shell is the Founder and Chief Investment Officer of Shell Capital Management, LLC, and the portfolio manager of ASYMMETRY® Global Tactical. Mike Shell and Shell Capital Management, LLC is a registered investment advisor focused on asymmetric risk-reward and absolute return strategies and provides investment advice and portfolio management only to clients with a signed and executed investment management agreement. The observations shared on this website are for general information only and should not be construed as advice to buy or sell any security. Securities reflected are not intended to represent any client holdings or any recommendations made by the firm. Any opinions expressed may change as subsequent conditions change. Do not make any investment decisions based on such information as it is subject to change. Investing involves risk, including the potential loss of principal an investor must be willing to bear. Past performance is no guarantee of future results. All information and data are deemed reliable but is not guaranteed and should be independently verified. The presence of this website on the Internet shall in no direct or indirect way raise an implication that Shell Capital Management, LLC is offering to sell or soliciting to sell advisory services to residents of any state in which the firm is not registered as an investment advisor. The views and opinions expressed in ASYMMETRY® Observations are those of the authors and do not necessarily reflect a position of Shell Capital Management, LLC. The use of this website is subject to its terms and conditions.

You must be logged in to post a comment.