In some cases, the recovery of economic and market trends are as impressive as the rate in which they fell.
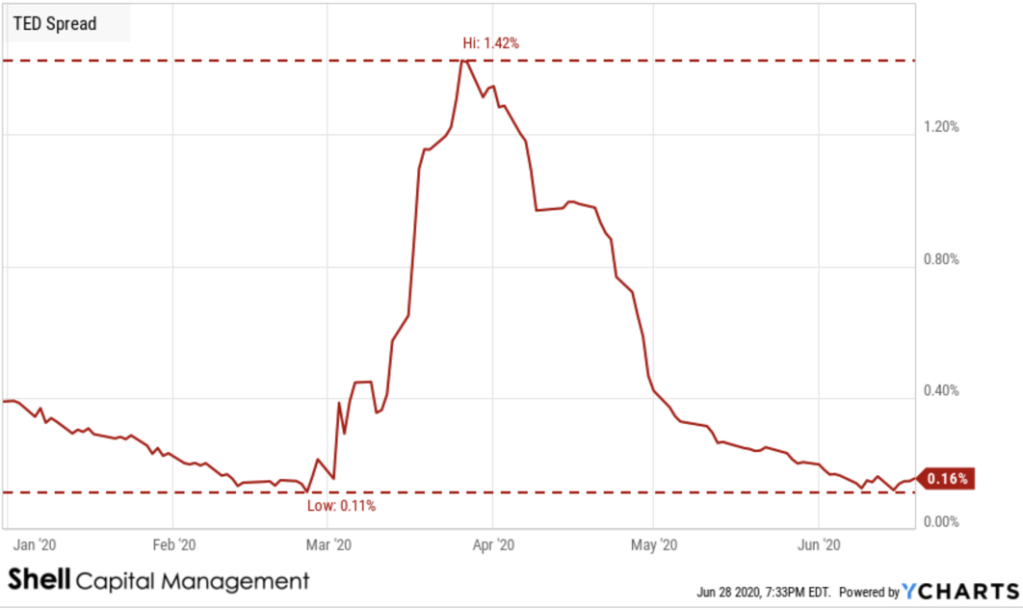
The so-called “panic button” indicator, TED Spread, is back down to low levels. The chart tracks the daily TED Spread (3 Month LIBOR relative to the 3 Month Treasury Bill) as a measure of the perceived credit risk in the U.S. economy. It tends to widen during times of economic uncertainty. The TED Spread spiked up briefly in March, but has since settled back down.
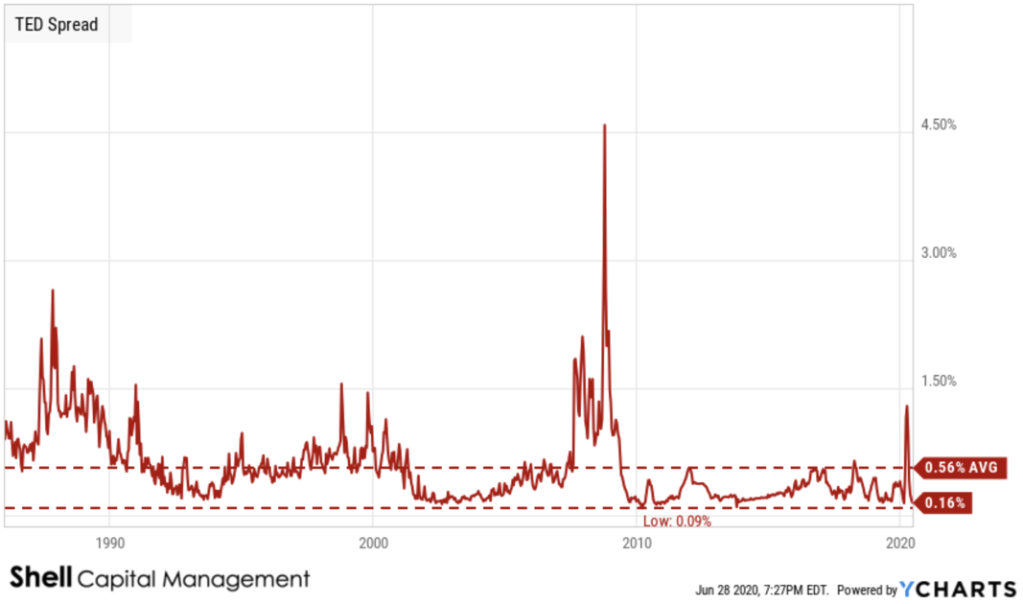
The TED Spread spiked up briefly in March, but has since settled back down.
German economic sentiment snapped back fast.
The ZEW Indicator of Economic Sentiment is a leading indicator for the German economy. It reflects the expectations in six months of 300 financial experts on inflation rates, interest rates, stock markets, exchange rates, and oil prices for leading global economies. A value greater than 0 reflects more optimism than pessimism and a value less than 0 reflects more pessimism than optimism with respect to economic sentiment.
ZEW Indicator of Economic Sentiment for Germany is at a current level of 63.40, which is right at the high it reached in 2014.
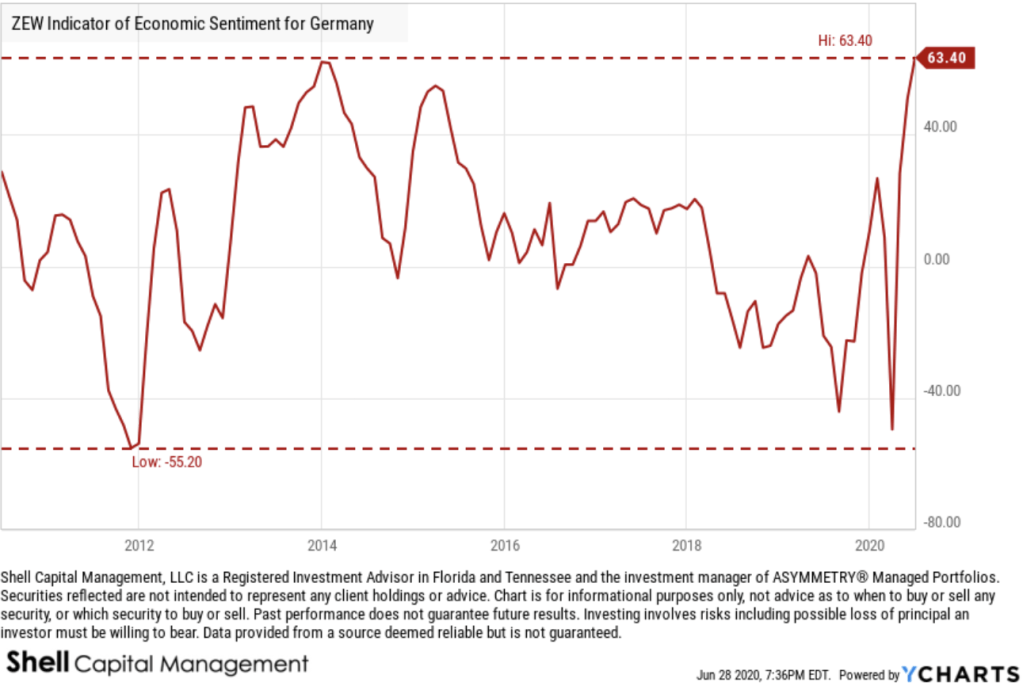
ZEW Indicator of Economic Sentiment for Germany and the Eurozone updates will be released tomorrow, so we’ll see how they have trended through June.
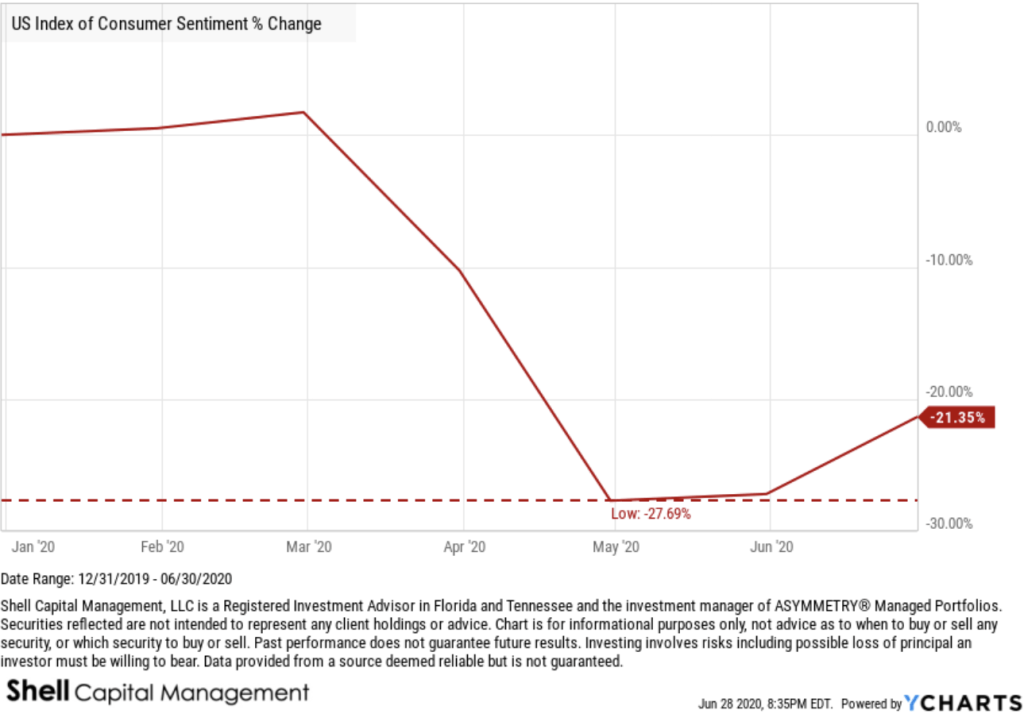
US Consumer Sentiment has trended up off its low. We’ll see if it can continue this uptrend with the COVID cases trending up again.
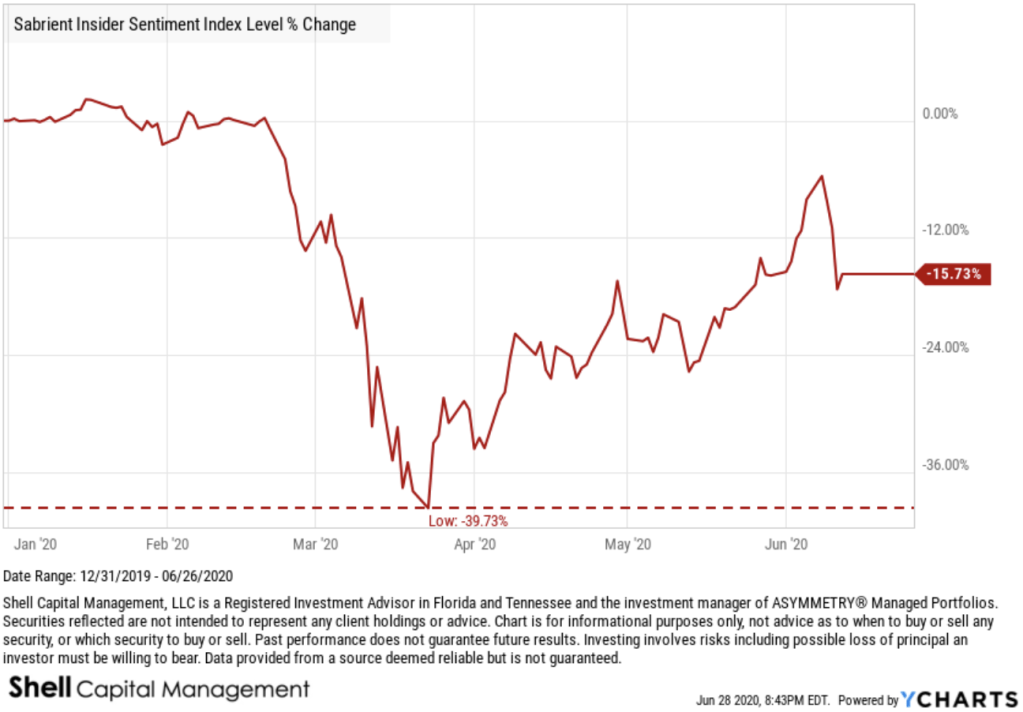
The Sabrient Insider Sentiment Index is designed to identify companies with potentially superior risk-return profiles that also are;
(1) reflecting favorable corporate insider buying trends (determined via the public filings of such corporate insiders) and/or
(2) have recent earnings estimate increases published by Wall Street analysts.
The Sabrient Insider Sentiment Index declined with the stock indexes in March and has recovered in similar fashion. As with investor sentiment measures, it seems to follow price. Nothing drives sentiment like the price trend.
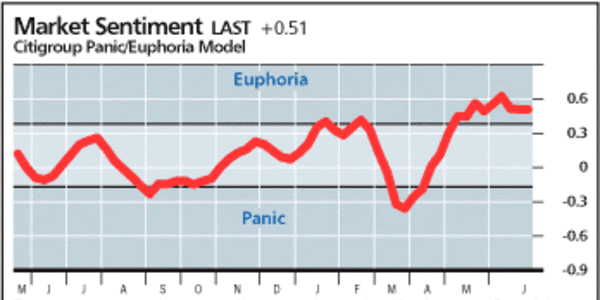
Speaking of sentiment, the Citigroup Panic/Euphoria model is a gauge of investor sentiment. It identifies “Panic” and “Euphoria” levels which are statistically driven buy and sell signals for the broader market. Historically, a reading below panic supports a better than 95% likelihood that stock prices will be higher one year later, while euphoria levels generate a better than 80% probability of stock prices being lower one year later.
The current reading of the Citigroup Panic/Euphoria model at 0.41 indicates euphoria and anything at or below -0.17 indicates panic.
The S&P 500 EQUAL WEIGHT is probably the best measure of the U.S. stock market. Here, I charted both the standard capitalization weighted index along with its Equal Weight counterpart. The cap-weighted S&P 500 is heavily driven by its top holdings, whereas the equal-weighted index holds about .20% in the 500 or so stocks in the index.
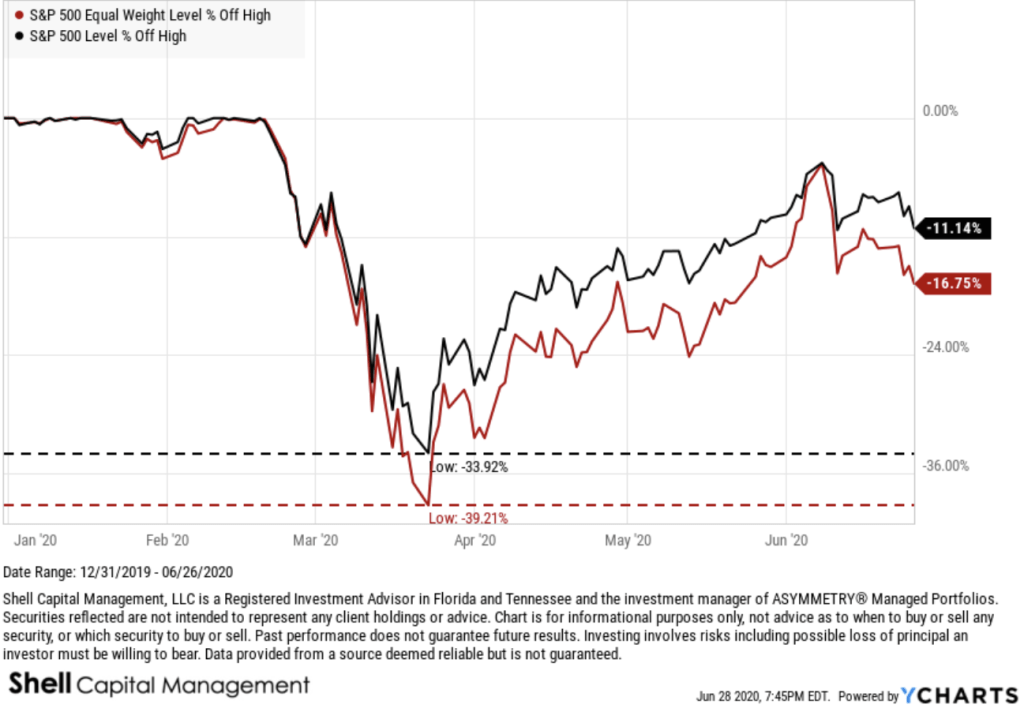
The S&P 500 Equal Weight Index declined -40% in March, which is more than the -34% of the S&P 500 weighted based on company size. The equal-weighted index also remains in a -17% drawdown off its highs, which is more than the standard SPX index, which is more weighted to the largest stocks.
For example, below are the top 25 stocks in the cap weighted S&P 500 everyone follows. As these top stocks have as much weighting in the index as 5%, the equal weight only holds about 0.20% in these same stocks.
| Symbol | Name | % Weight |
| MSFT | Microsoft Corp | 5.94% |
| AAPL | Apple Inc | 5.81% |
| AMZN | Amazon.com Inc | 4.51% |
| FB | Facebook Inc A | 2.22% |
| GOOGL | Alphabet Inc A | 1.69% |
| GOOG | Alphabet Inc Class C | 1.65% |
| JNJ | Johnson & Johnson | 1.44% |
| BRK.B | Berkshire Hathaway Inc Class B | 1.36% |
| V | Visa Inc Class A | 1.28% |
| JPM | JPMorgan Chase & Co | 1.17% |
| PG | Procter & Gamble Co | 1.14% |
| UNH | UnitedHealth Group Inc | 1.10% |
| HD | The Home Depot Inc | 1.03% |
| MA | Mastercard Inc A | 1.03% |
| INTC | Intel Corp | 0.97% |
| NVDA | NVIDIA Corp | 0.91% |
| VZ | Verizon Communications Inc | 0.88% |
| T | AT&T Inc | 0.83% |
| ADBE | Adobe Inc | 0.82% |
| NFLX | Netflix Inc | 0.80% |
| PYPL | PayPal Holdings Inc | 0.79% |
| DIS | The Walt Disney Co | 0.79% |
| MRK | Merck & Co Inc | 0.76% |
| BAC | Bank of America Corp | 0.75% |
| CSCO | Cisco Systems Inc | 0.75% |
The price trend for Emerging Markets stocks has been dismal since the 2007 peak, which has had some negative impact on global macro. That is, considering the killer trend from 2003 to 2007 has a strong return driver for us, it hasn’t been the case since then. So, we’ve not had much exposure to EM, even though it’s now considered undervalued relative to the rest of the world, for me, it has to be trending up with some momentum. This tend is non-trending and volatile.
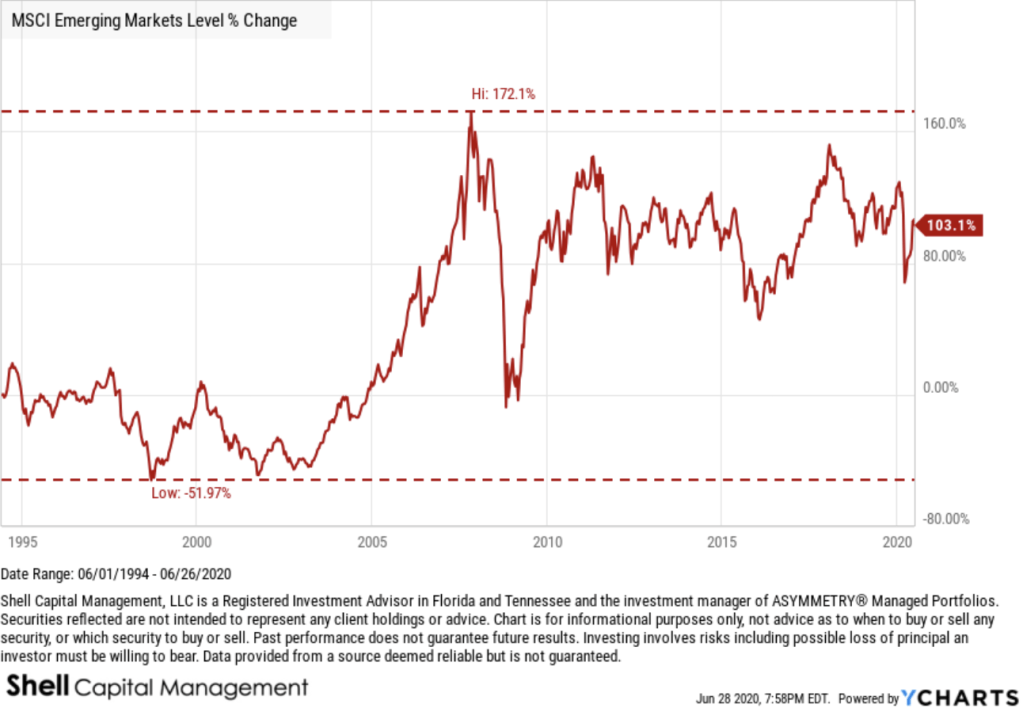
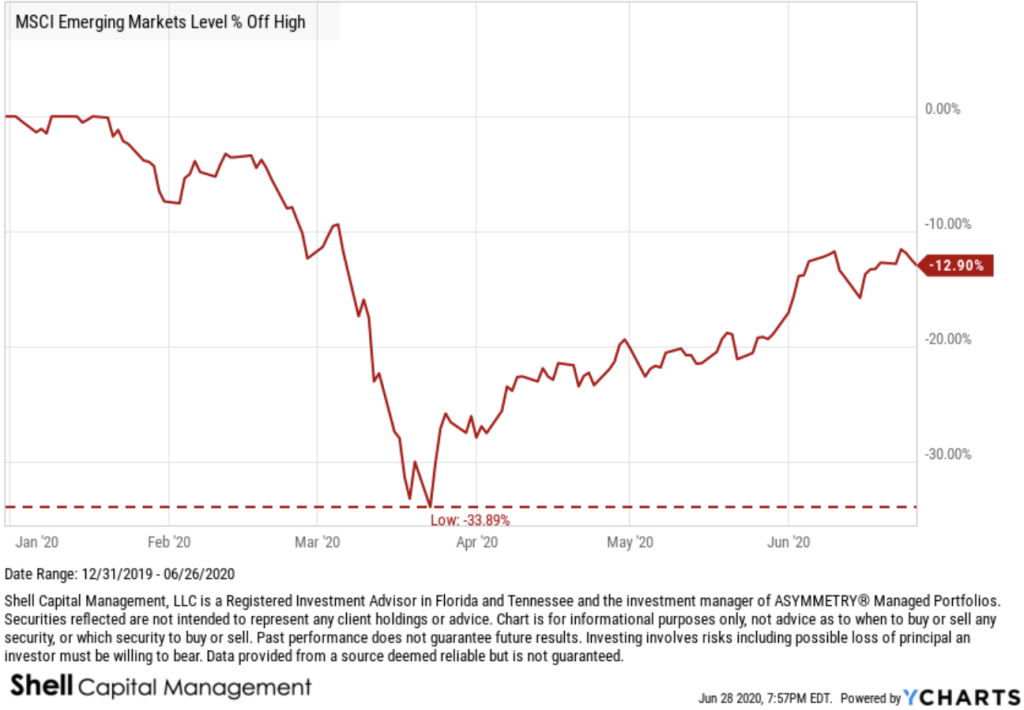
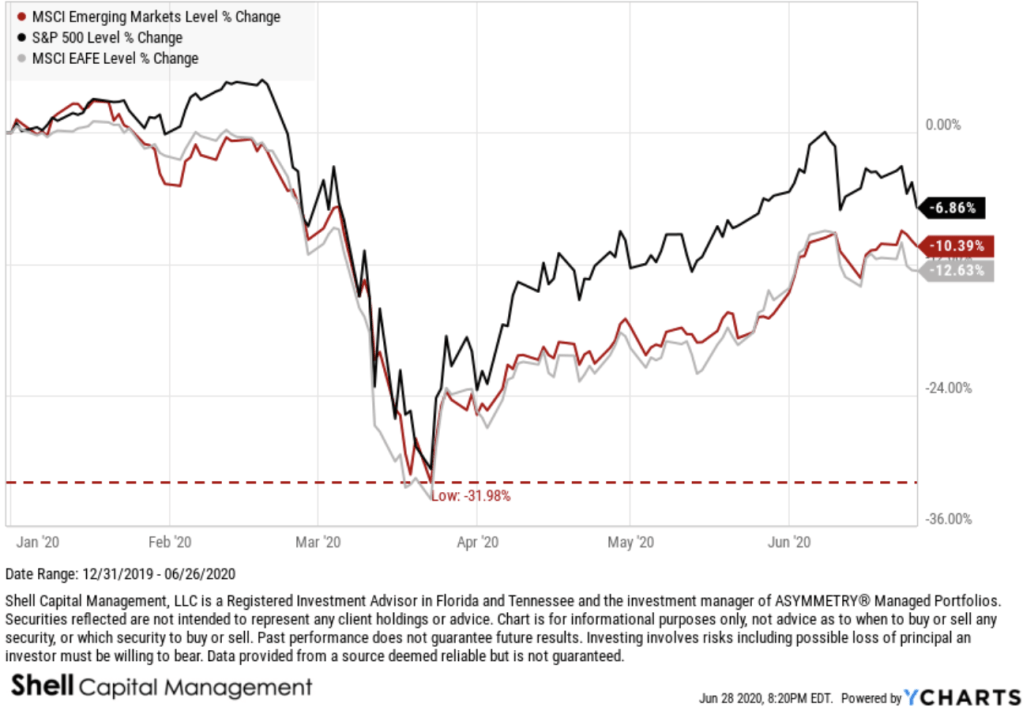
Zooming in to the year to date, at least the MSCI Emerging Markets Index only declined about the same as US stocks.
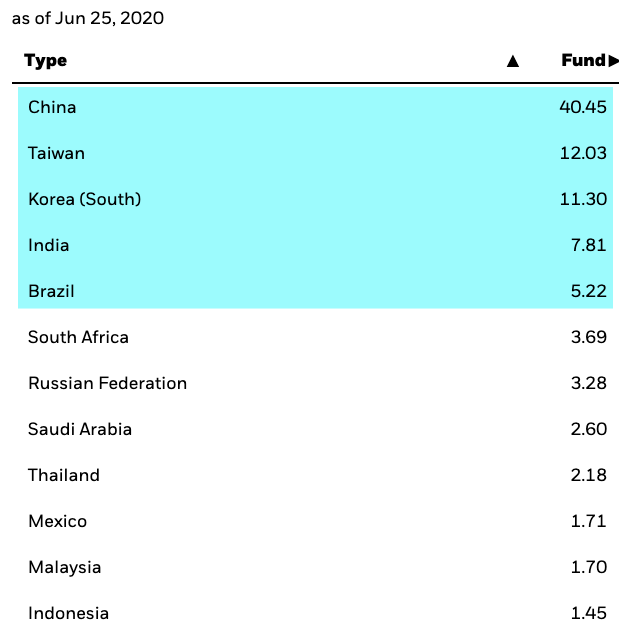
Looking inside the EM Index we see the top country exposures are China, Taiwan, South Korea, India, and Brazil, all of which we can gain portfolio exposure via ETFs.
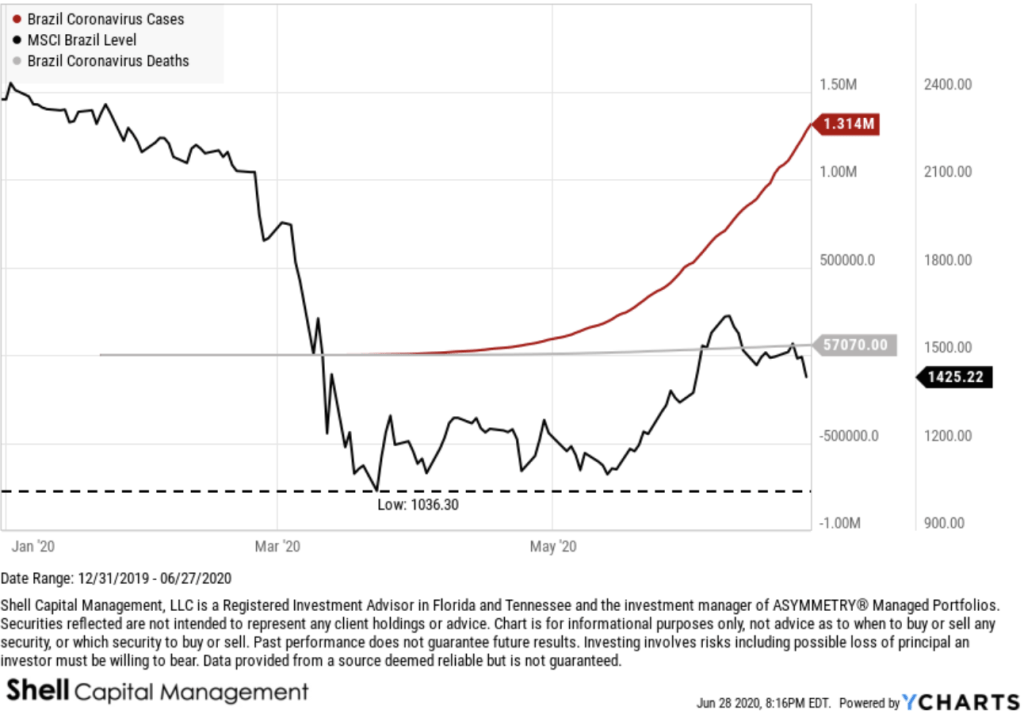
Looking at these individual emerging countries, Brazil has been hammered the most, Taiwan, Korea, and China have been relatively resilient.
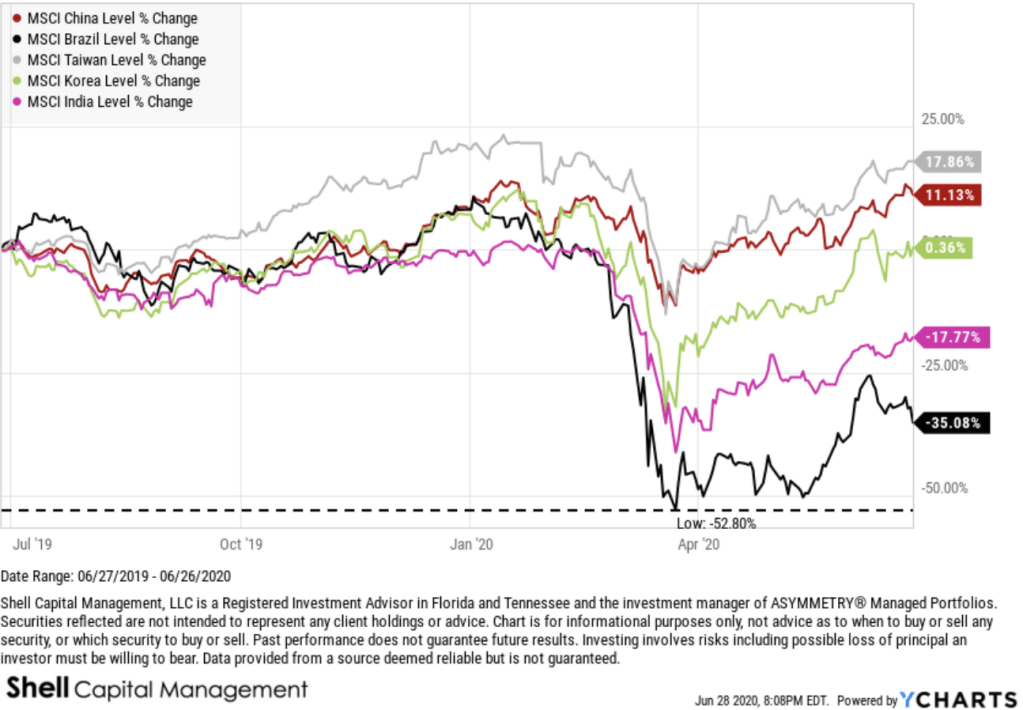
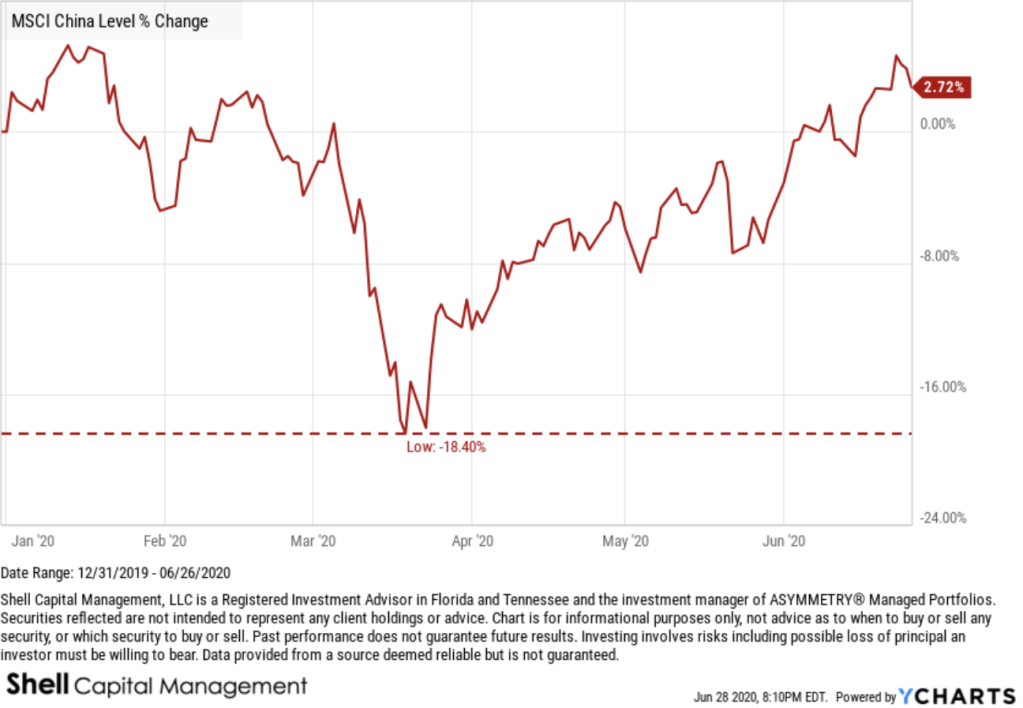
In fact, the trend in China is probably surprising to investors, especially considering it’s where the COVID-19 Coronavirus started. China only had a -18.4% drawdown priced in US Dollars.
Brazil has some of the worse COVID trends in the world right now, which isn’t helping their stock market trend either.
Here’s a view of the global stock market trends. Though they are down from their February 2020 highs, they are well above their March 2020 lows.
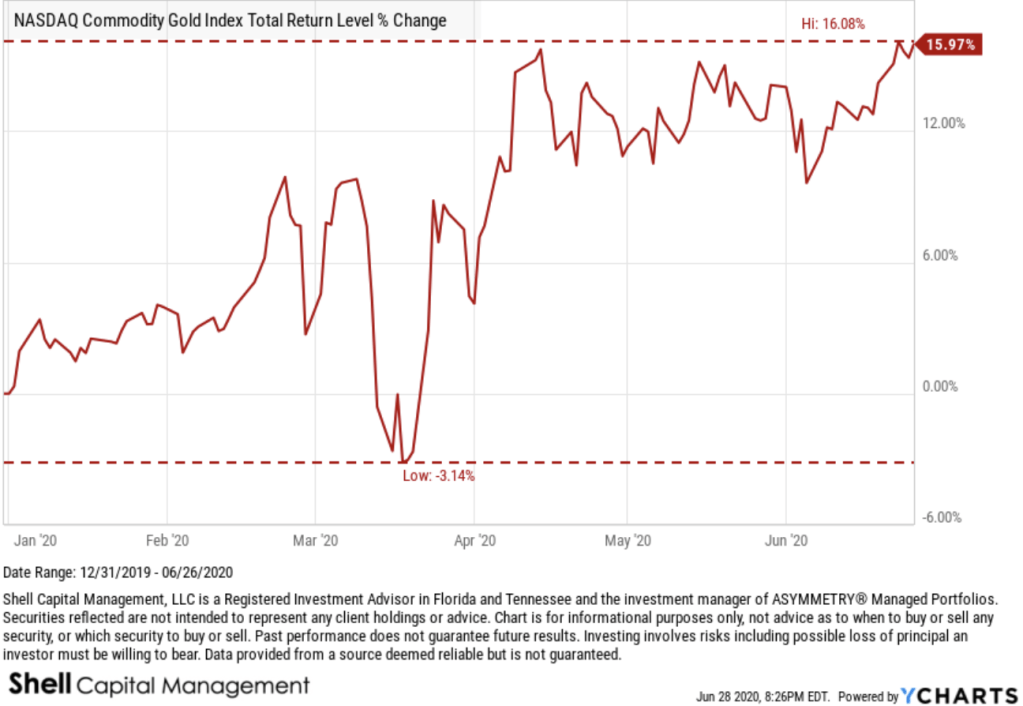
Gold has had one of the most asymmetric risk/reward profiles YTD. In 2020, Gold has only only down about -3% and a drawdown from its peak of -11%, but it has gained 16%. That’s relatively strong asymmetry.
Gold is no contest against the long term US Treasury Index in 2020. Long Term US Treasuries have the strongest momentum and asymmetric risk/reward year to date, which is why I have exposure. Gold has still been a good asymmetric risk/reward, though.
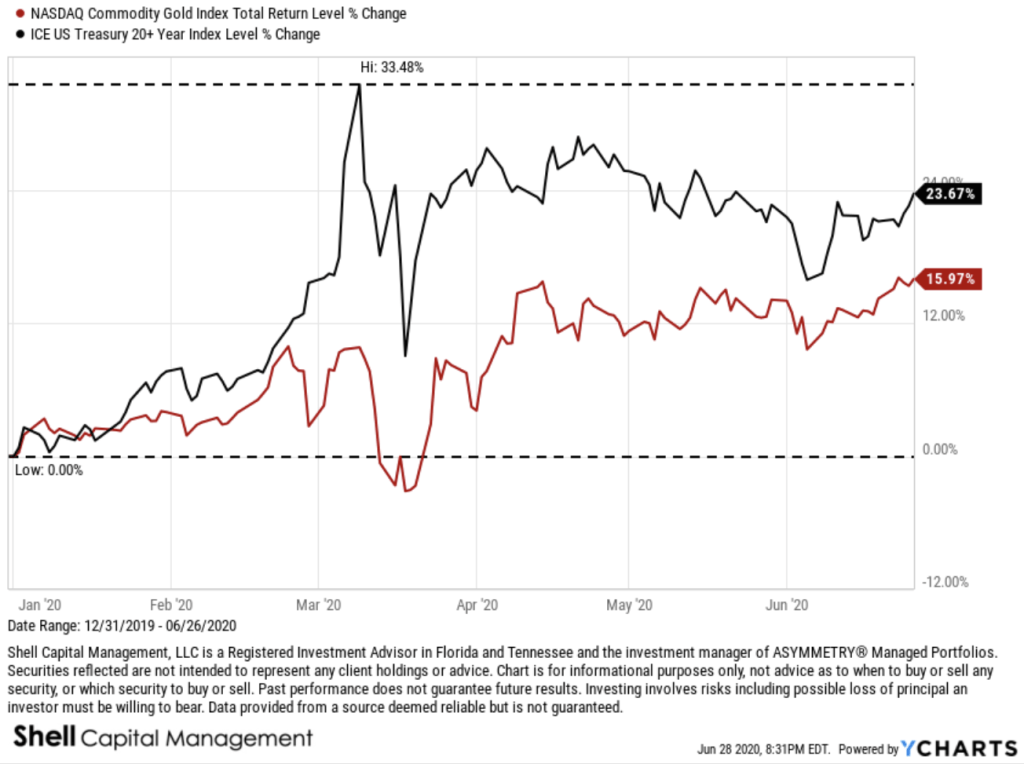
We remain on defense and invested in bonds for now as they seem to exhibit the most asymmetric risk reward.
Mike Shell is the Founder and Chief Investment Officer of Shell Capital Management, LLC, and the portfolio manager of ASYMMETRY® Global Tactical. Mike Shell and Shell Capital Management, LLC is a registered investment advisor focused on asymmetric risk-reward and absolute return strategies and provides investment advice and portfolio management only to clients with a signed and executed investment management agreement. The observations shared on this website are for general information only and should not be construed as advice to buy or sell any security. Securities reflected are not intended to represent any client holdings or any recommendations made by the firm. Any opinions expressed may change as subsequent conditions change. Do not make any investment decisions based on such information as it is subject to change. Investing involves risk, including the potential loss of principal an investor must be willing to bear. Past performance is no guarantee of future results. All information and data are deemed reliable but is not guaranteed and should be independently verified. The presence of this website on the Internet shall in no direct or indirect way raise an implication that Shell Capital Management, LLC is offering to sell or soliciting to sell advisory services to residents of any state in which the firm is not registered as an investment advisor. The views and opinions expressed in ASYMMETRY® Observations are those of the authors and do not necessarily reflect a position of Shell Capital Management, LLC. The use of this website is subject to its terms and conditions.

You must be logged in to post a comment.