I primarily focus on directional price trends, momentum, volatility, and investor sentiment. That is, until economic trends trend to extremes. Then I start observing these global macro trends.
We monitor thousands and data streams and time series with quantitative alerts that signal when these trends change. We are seeing many economic trends in uncharted territory.
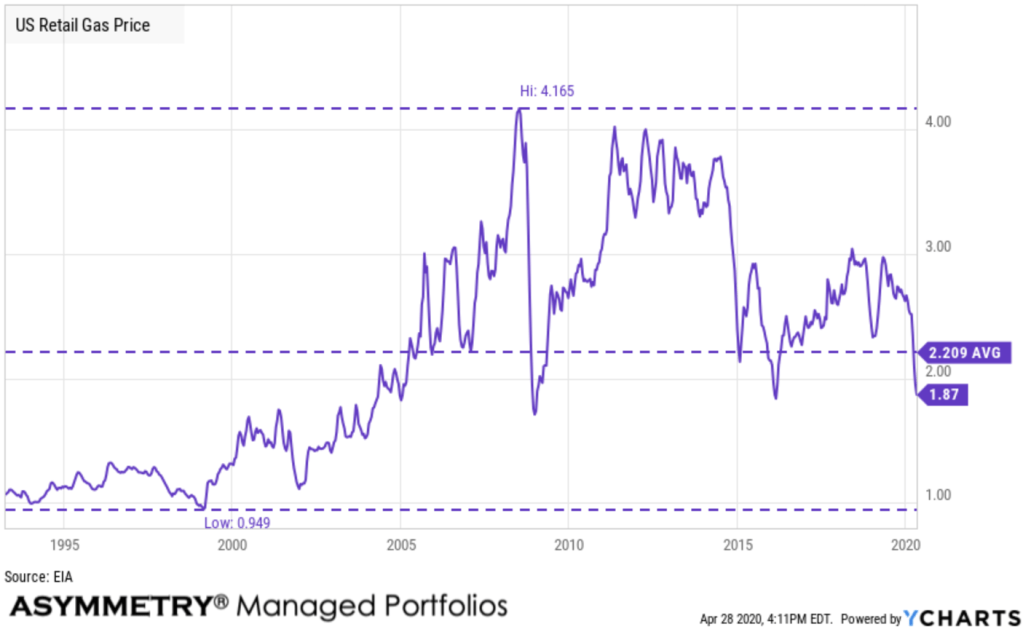
US Retail Gas
The US Retail Gas Price is the average price that retail consumers pay per gallon, for all grades and formulations. Retail gas prices are important to view in regards to how the energy industry is performing. Additionally, retail gas prices can give a good overview of how much discretionary income consumers might have to spend. The current price is $1.87 which is below the average of $2.21 and near the prior lows in 2016 and 2009. In the late 1990s gas was around $1 and traded as high as $4 in 2007-08.
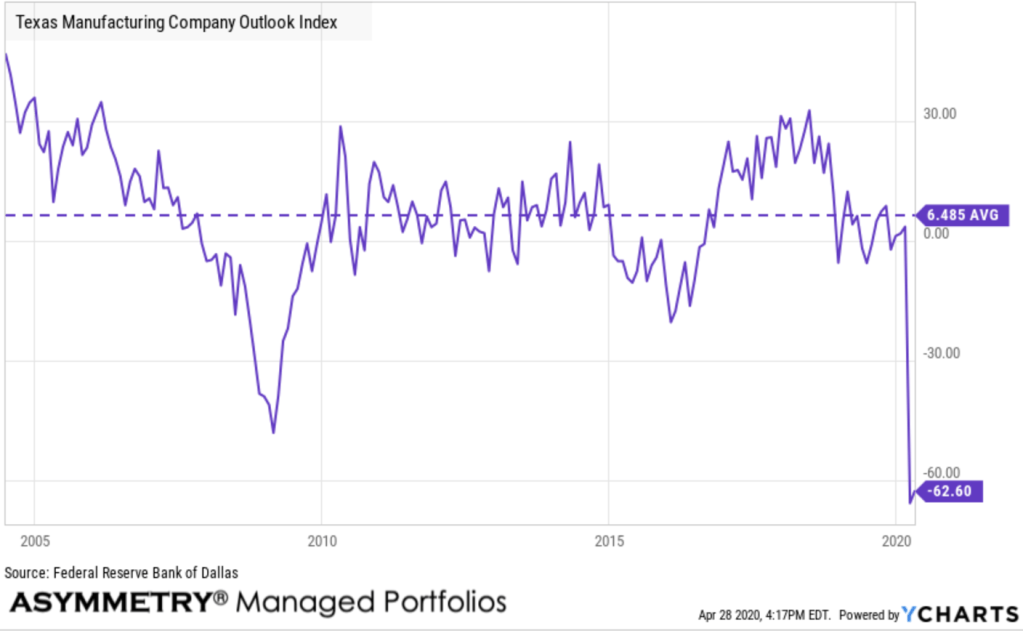
Texas Manufacturing Outlook Survey
The Dallas Fed conducts the Texas Manufacturing Outlook Survey monthly to obtain a timely assessment of the state’s factory activity. Companies are asked whether output, employment, orders, prices and other indicators increased, decreased or remained unchanged over the previous month. Responses are aggregated into balance indexes where positive values generally indicate growth while negative values generally indicate contraction. It’s at a new low, so the Texas Manufacturing Outlook Survey is in uncharted territory.
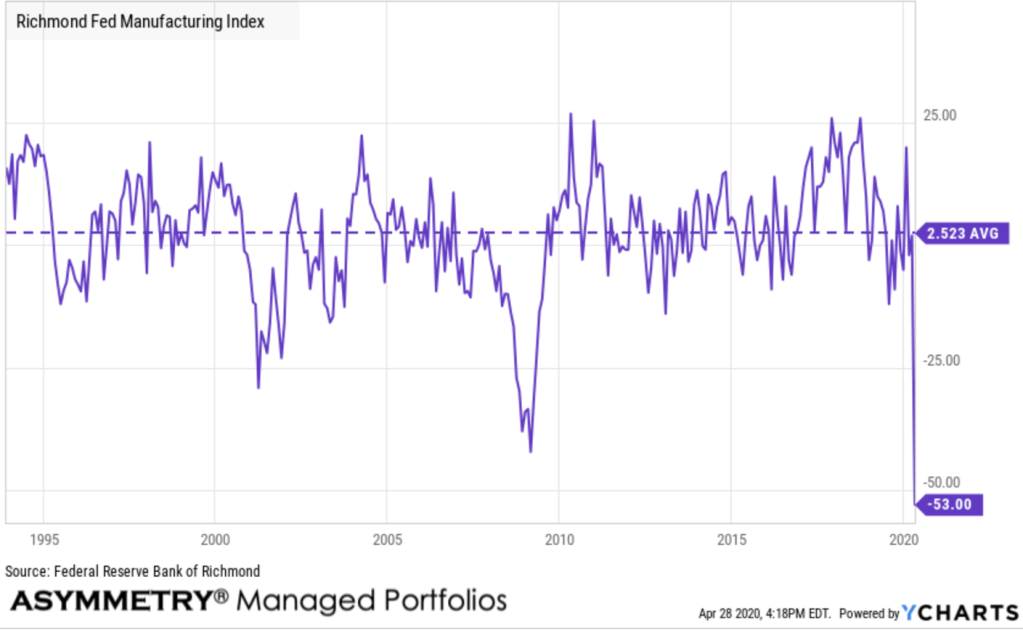
Richmond Fed Survey of Manufacturing Activity
The Survey of Manufacturing Activity is sent electronically to manufacturing firms that are selected for participation according to their type of business, location, and firm size. About 200 contacts receive questionnaires and approximately 90 to 95 of those surveyed respond in a typical month. Respondents report on various aspects of their business, such as shipments, new orders, order backlogs, inventories, and expectations for business activity during the next six months. It fell to a new low, so another has reached uncharted territory.
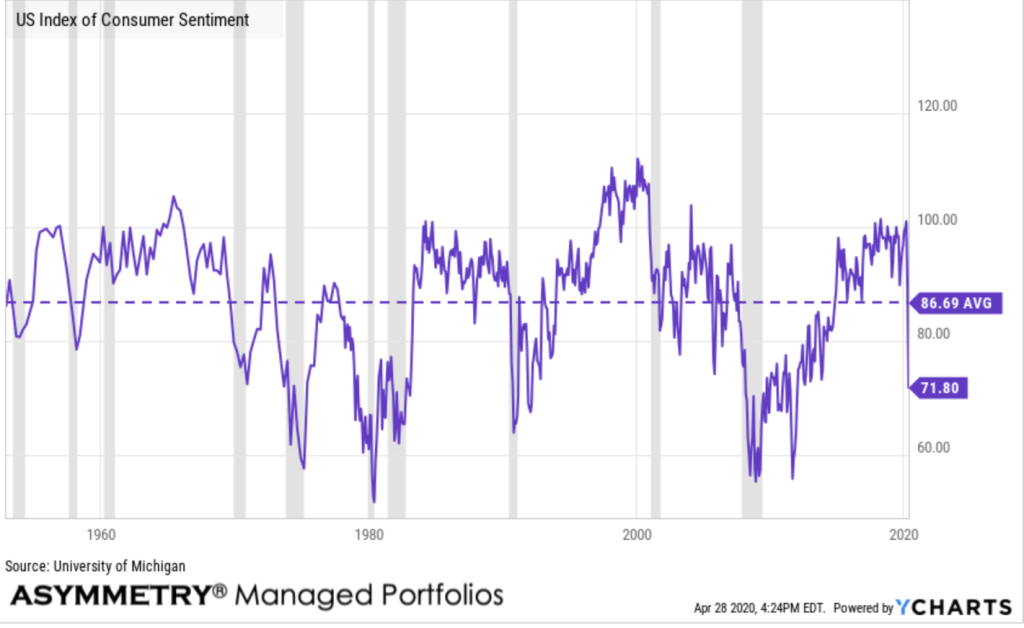
US Index of Consumer Sentiment
US Index of Consumer Sentiment is at a current level of 71.80, a decrease of 17.30 or 19.42% from last month. This is a decrease of 25.40 or 26.13% from last year and is lower than the long term average of 86.69. The US Index of Consumer Sentiment (ICS), as provided by University of Michigan, tracks consumer sentiment in the US, based on surveys on random samples of US households. The index aids in measuring consumer sentiments in personal finances, business conditions, among other topics. Historically, the index displays pessimism in consumers’ confidence during recessionary periods, and increased consumer confidence in expansionary periods. Consumer sentiment is materially below its long term average.
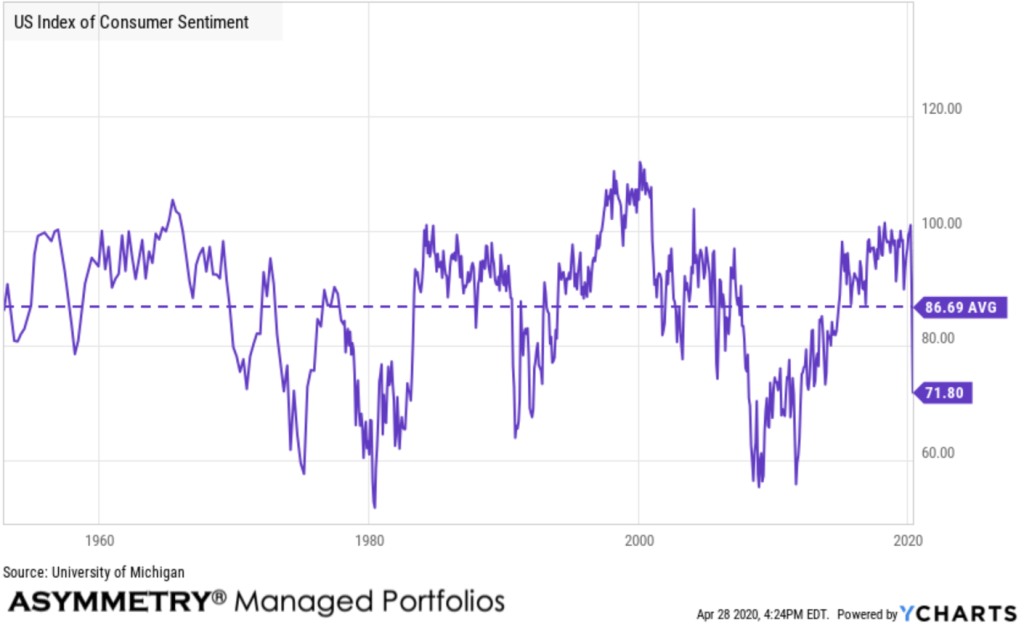
Since the index shows pessimism in consumers’ confidence during recessionary periods, in the next chart I highlight historical recessions in gray to illustrate.
Hey Crude… WTI Crude Oil Spot Price trended negative. WTI Crude Oil Spot Price is at a current level of -36.98, down from 18.31 the previous market day and down from 64.02 one year ago. Clearly, WTI Crude has reached uncharted territory.
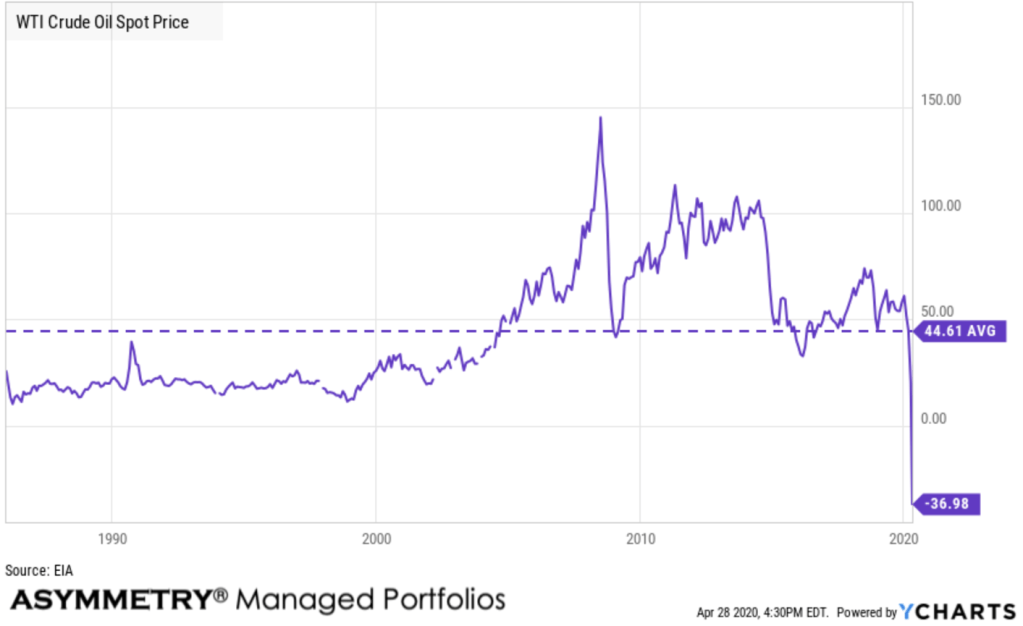
WTI Crude Oil Spot Price is the price for immediate delivery of West Texas Intermediate grade oil, also known as Texas light sweet. It, along with Brent Spot Price, is one of the major benchmarks used in pricing oil. WTI in particular is useful for pricing any oil produce in the Americas. One of the most notable times for the WTI Crude Oil Spot Price was in 2008 when prices for WTI Crude reached as high as $145.31/barrel because of large cuts in production. However, because of the financial crisis and an abrupt loss of demand for oil globally, the price of WTI Crude fell as much at 70% off highs in January of 2009.
US Inflation Rate
The US Inflation Rate is the percentage in which a chosen basket of goods and services purchased in the US increases in price over a year. Inflation is one of the metrics used by the US Federal Reserve to gauge the health of the economy. Since 2012, the Federal Reserve has targeted a 2% inflation rate for the US economy and may make changes to monetary policy if inflation is not within that range. A notable time for inflation was the early 1980’s during the recession. Inflation rates went as high as 14.93%, causing the Federal Reserve led by Paul Volcker to take dramatic actions.
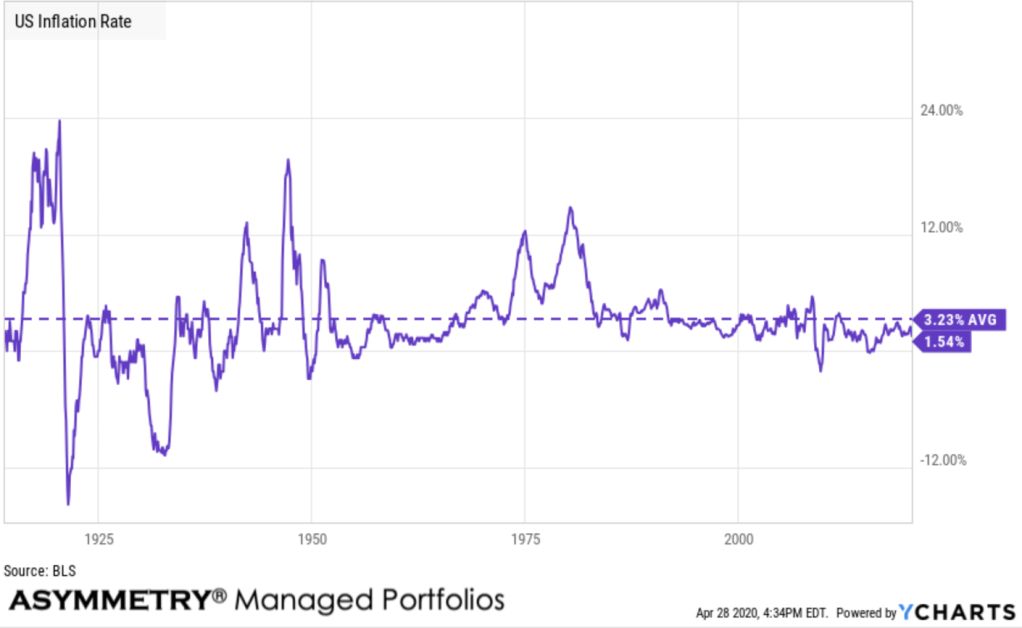
With commodities like gasoline and crude falling, it should be no surprise to see inflation trend down. US Inflation Rate is at 1.54%, compared to 2.33% last month and 1.86% last year. This is lower than the long term average of 3.23%.
10 Year Treasury Rate
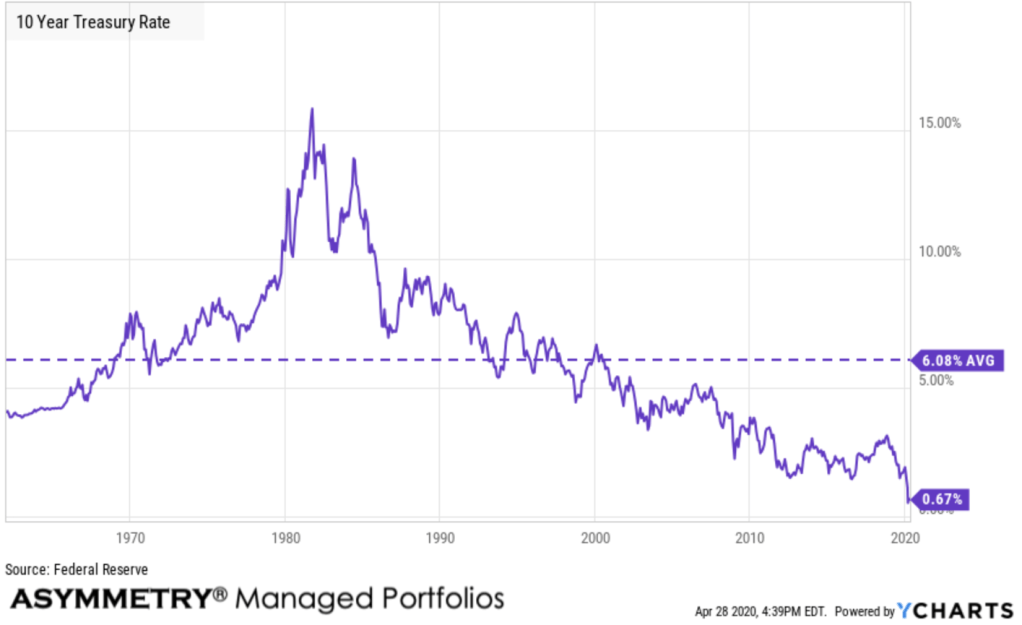
10 Year Treasury Rate is at 0.67%, compared to 2.51% last year. The 10 Year Treasury Rate is the yield received for investing in a US government issued treasury security that has a maturity of 10 year. The 10 year treasury yield is included on the longer end of the yield curve. Many analysts will use the 10 year yield as the “risk free” rate when valuing the markets or an individual security. Historically, the 10 Year treasury rate reached 15.84% in 1981 as the Fed raised benchmark rates in an effort to contain inflation. The 10 Year Treasury Rate is in uncharted territory.
US Initial Jobless Claims has trended up with such magnitude I almost hate to show it.
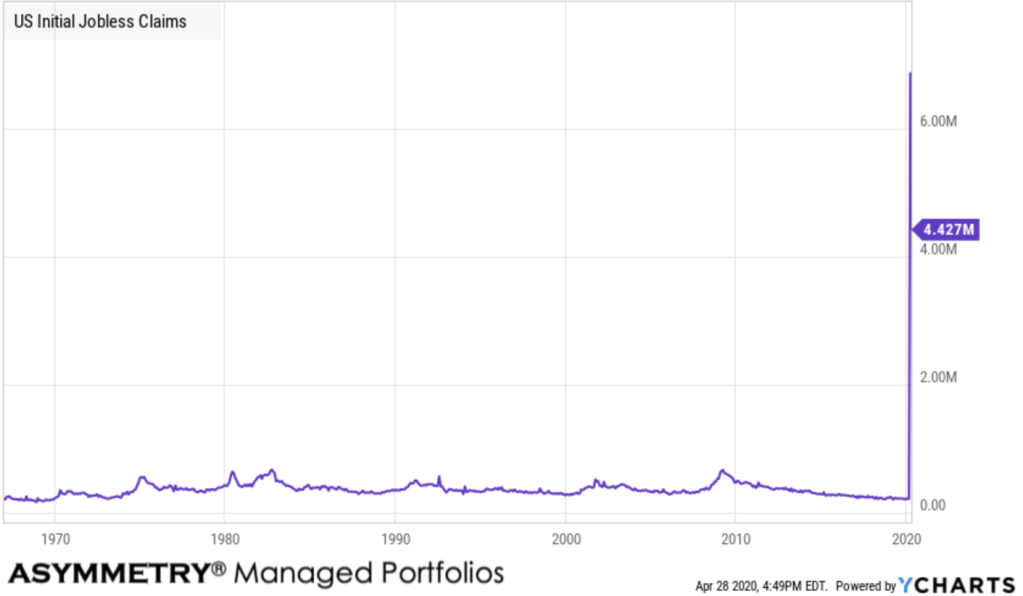
US Initial Jobless Claims is at a current level of 4.427 million last week, a decrease of 810,000 or 15.47% from last week. US Initial Jobless Claims, provided by the US Department of Labor, provides underlying data on how many new people have filed for unemployment benefits in the previous week. Given this, one can gauge market conditions in the US economy with respect to employment; as more new individuals file for unemployment benefits, fewer individuals in the economy have jobs. Historically, initial jobless claims tended to reach peaks towards the end of recessionary periods such as on March 21, 2009 with a value of 661,000 new filings.
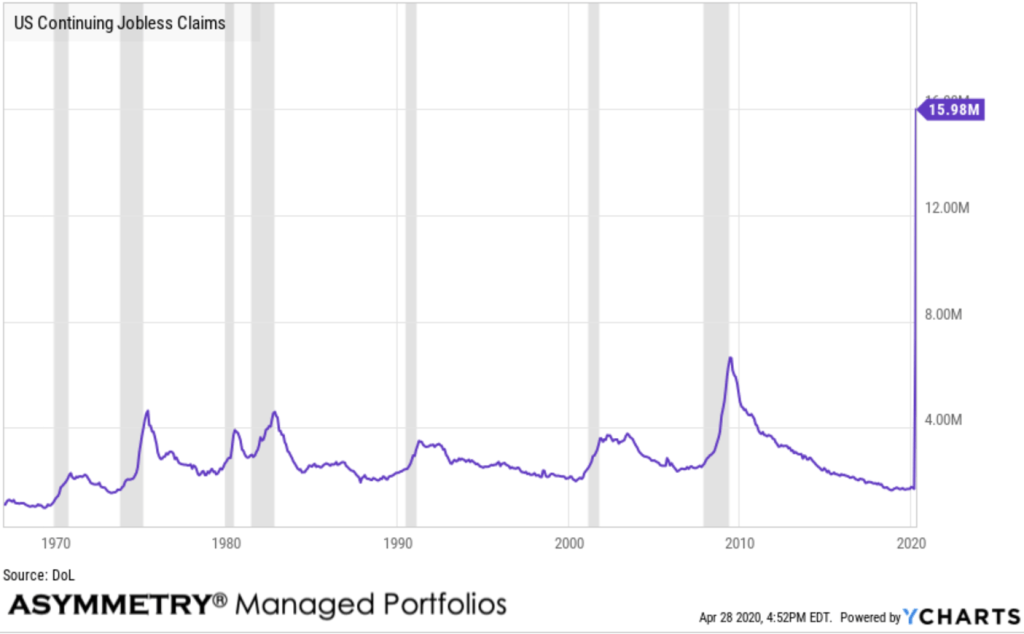
US Continuing Jobless Claims
US Continuing Jobless Claims is at a current level of 15.98M, up from 11.91M last week and up from 1.654 million one year ago. This is a change of 34.12% from last week and 865.9% from one year ago. I marked historical recessions in gray to show continuing jobless claims trend up in recession.
US Federal Reserve is in uncharted territory
The US Federal Reserve is taking massive action in attempt to fend off a crisis. We had seen unprecedented quantitative easing the past decade, but it was wimpy compared to what we are seeing now.
US Total Assets Held by All Federal Reserve Banks is the total value of assets held by all the the Federal Reserve banks. This can include treasuries, mortgage-backed securities, federal agency debt and and so forth. During the Great Recession, having already lowered the target interest rate to 0%, the Federal Reserve further attempted to stimulate the US economy by buying and holding trillions of dollars worth of US treasuries and mortgage-backed securities, a process known as Quantitative Easing or QE. This time, they are doing anything necessary.
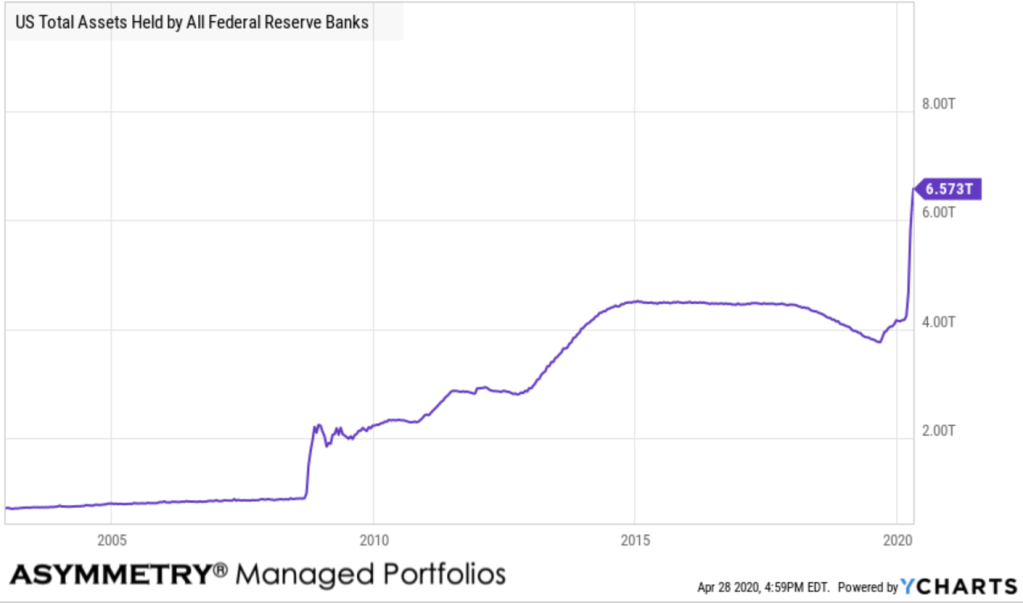
US Total Assets Held by All Federal Reserve Banks is at a current level of 6.573 TRILLION, up from 6.368 TRILLION last week and up from 3.932 TRILLION one year ago. This is a change of 3.22% from last week and 67.18% from one year ago.
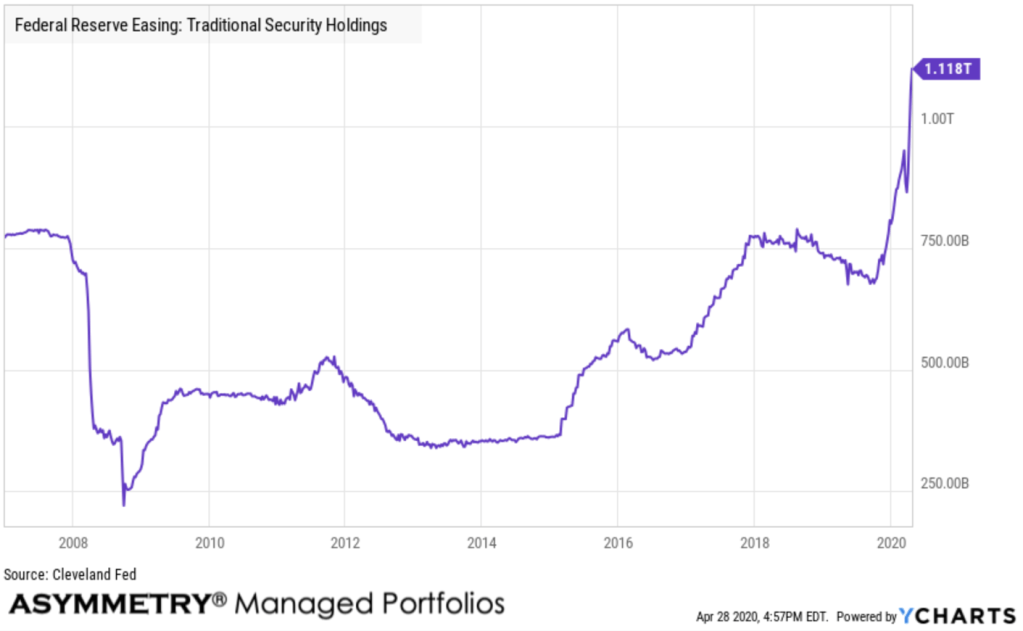
Federal Reserve Easing: Traditional Security Holdings is at a current level of 1.118T, up from 1.074T last week and up from 724.75B one year ago. This is a change of 4.07% from last week and 54.25% from one year ago.
So, you want to know if things are going back to normal anytime soon?
Maybe not.
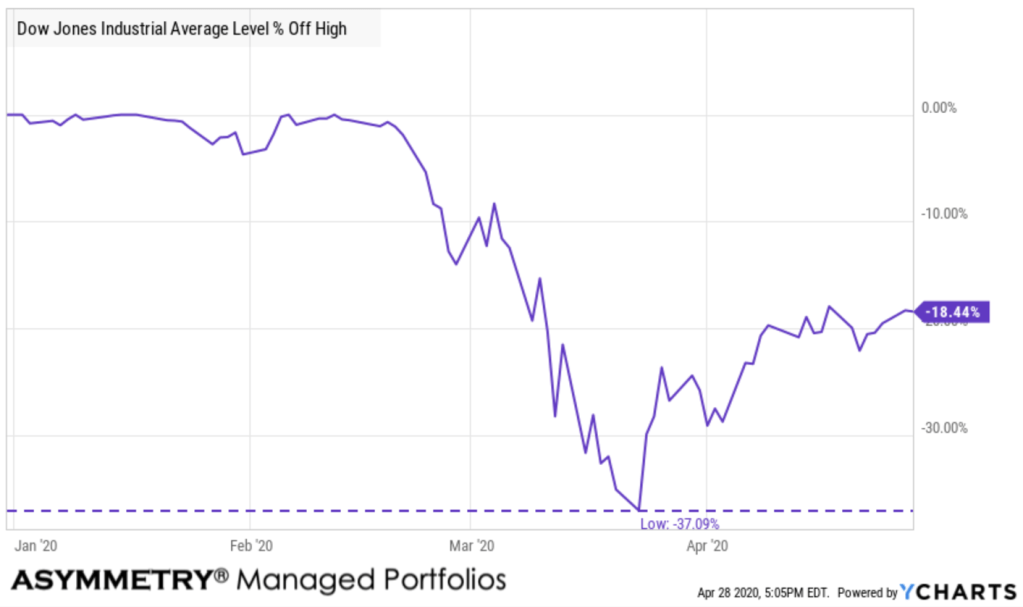
But, the Dow Jones Industrial average declined -37% in a month and has retraced about half of the loss this past month.
The market climbs a wall of worry and during extreme times like this, markets do what you least expect.
We’ve been invested in stocks again the past few weeks, but only time will tell if we see the stock market trend back down, or reaches a new high.
Big bear markets swing up and down along the way to lower lows, so that’s what I expect is likely here. I operated successfully through both of the last two bear markets and trade the swings. It’s not as simple as an ON/OFF switch of existing at the peak, as we did in February, and then reentering at “the” low. Instead, for me, it’s a lots of entries and exits as it all unfolds.
We’ll probably see a reversal back down at some point, but we may not. If there’s anything I’ve learned the hard way, it’s don’t fight the Fed. But, Fed interference isn’t a sure thing, either. It doesn’t matter, for me, my process doesn’t require me to figure out what’s going to happen next. Instead, I know how I’ll take risks and when the risk/reward is more likely asymmetric. If the risks don’t pan out, I’ll cut my loss short and try again.
I’ve done it over and over and over again, which discipline.
I’ve been here before, many times. This is when I do things very different from the crowd and it has historically made all the difference. There is never any guarantee of the future, but I’m as ready as I’ve ever been. With the past experiences, I’m more prepared than ever.
I’m looking forward to it.
Let’s roll.
Mike Shell is the Founder and Chief Investment Officer of Shell Capital Management, LLC, and the portfolio manager of ASYMMETRY® Global Tactical. Mike Shell and Shell Capital Management, LLC is a registered investment advisor focused on asymmetric risk-reward and absolute return strategies and provides investment advice and portfolio management only to clients with a signed and executed investment management agreement. The observations shared on this website are for general information only and should not be construed as advice to buy or sell any security. Securities reflected are not intended to represent any client holdings or any recommendations made by the firm. Any opinions expressed may change as subsequent conditions change. Do not make any investment decisions based on such information as it is subject to change. Investing involves risk, including the potential loss of principal an investor must be willing to bear. Past performance is no guarantee of future results. All information and data are deemed reliable but is not guaranteed and should be independently verified. The presence of this website on the Internet shall in no direct or indirect way raise an implication that Shell Capital Management, LLC is offering to sell or soliciting to sell advisory services to residents of any state in which the firm is not registered as an investment advisor. The views and opinions expressed in ASYMMETRY® Observations are those of the authors and do not necessarily reflect a position of Shell Capital Management, LLC. The use of this website is subject to its terms and conditions.

You must be logged in to post a comment.