The trend has changed for U.S. stocks since I shared my last observation. On January 27th I pointed out in The U.S. Stock Market Trend that the directional trend for the popular S&P 500® U.S. large cap stock index was still up, though it declined more than -10% twice over the past year. At that point, it had made a slightly lower high but held a higher low. Since then, theS&P 500® declined to a lower low.
First, let’s clearly define a trend in simple terms. A trend is following a general course of direction. Trend is a direction that something is moving, developing, evolving, or changing. A trend is a directional drift, one way or another. I like to call them directional trends. There is an infinite number of trends depending on the time frame. If you watch market movements daily you would probably respond to each day’s gain or loss thinking the trend was up or down based on what it just did that day. The professional traders who execute my trades for me probably consider every second a trend because they want to execute the buy or sell at the best price. As a tactical position trader, I look at multiple time frames from months to years rather than seconds or a single day. So, trends can be up over one time frame and down over another.
As we observe the direction of “the trend”, let’s consider the most basic definitions over some specific time frame.
- Higher highs and higher lows is an uptrend.
- Lower lows and lower highs is a downtrend.
- If there is no meaningful price break above or below those prior levels, it’s non-trending.
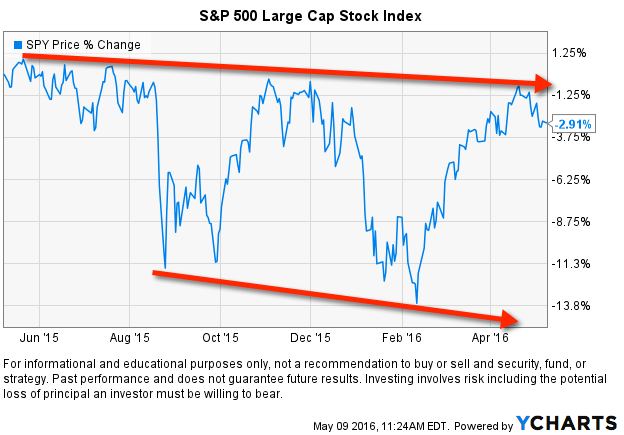
Below is the past year of the S&P 500® stock index, widely regarded as a representation of large cap stocks. Notice the key pivot points. The top of the price trend is lower highs. The bottom of the range is lower lows. That is a “downtrend” over the past year. It could break above the lower highs and hold above that level and shift to an uptrend, but for now, it is a downtrend. It could also keep swinging up and down within this range as it has the past year, or it could break down below the prior low. At this moment, it’s a downtrend. And, it’s a downtrend occurring after a 7-year uptrend that began March 2009, so we are observing this in the 7th year of a very aged bull market. As I said in The REAL Length of the Average Bull Market, the average bull market lasts around 4 years. This one was helped by unprecedented government intervention and is nearly double that length.
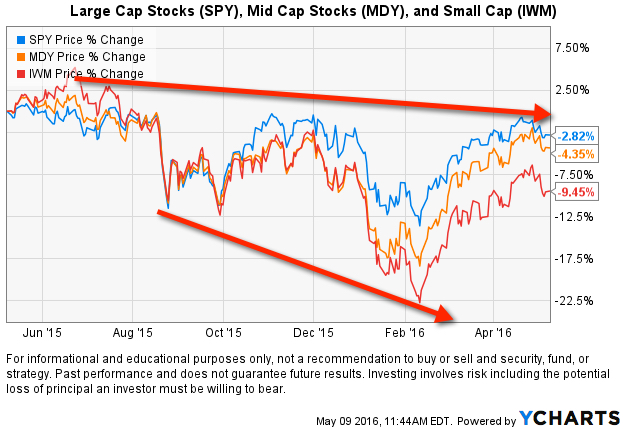
Another interesting observation is the trend of small and mid-size company stocks. In the next chart, we add small and mid-size company stock indexes. As you see, they are both leading on the downside. Small and mid-size company stocks have made even more pronounced lower highs and lower lows. Market trends don’t always play out like a textbook, but this time, it is. For those who want a story behind it, small and mid-size company stocks are expected to fall first and fall more in a declining market because smaller companies are considered riskier. On the other hand, they are expected to trend up faster and stronger since a smaller company should reflect new growth sooner than a larger company. It doesn’t always play out that way, but over the past year, the smaller companies have declined more. Large companies could catch up with them if the declining trend continues.
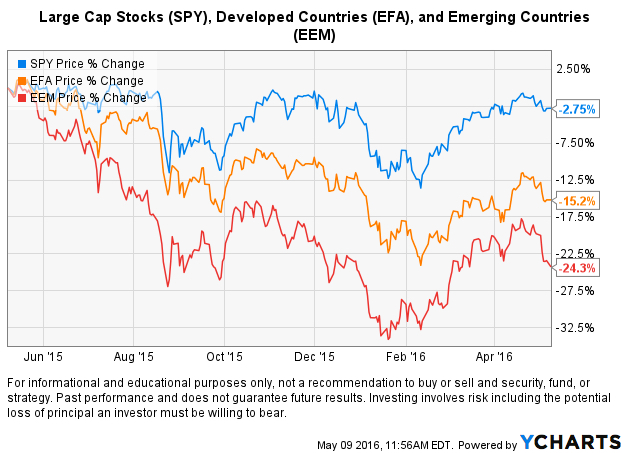
What about International stocks? Below I included International indexes of developed countries (EFA) with exposure to a broad range of companies in Europe, Australia, Asia, and the Far East. I also added the emerging markets index (EEM) that is exposure to countries considered to be “emerging” like China, Brazil, and India. Just as small U.S. stocks have declined more than mid-sized and mid-sized have declined more than large companies, emerging markets and developed International countries have declined even more than all of them.
What in the world is going on?
Well, within U.S. and International stocks, the general trends have been down. This could change at any time, but for now, it is what it is.
You can probably see why I think actively managing risk is so important.
This is not investment advice. If you need individualized advice please contact us or your advisor. Please see Terms and Conditions for additional disclosures.

Mike,
Given the data points presented above, at what point do you consider that a major trend reversal has taken place?
All of those indexes made lower highs at this point and lower lows. At this point, I consider the most recent failure to make a new higher high is likely “a major trend reversal”. Keeping in mind, that is the case not only with the large cap 500 but also the smaller companies and International even more pronounced. And, it can and will change direction again at some point… it is what it is.