When I say “The Trend” that could mean an infinite number of “trends“. The general definition of “trend” is a general tendency or course of events.
But when I speak of “The Trend” I mean a direction that something is moving, developing, evolving, or changing. A trend, to me, is a directional drift, one way or another. When I speak of price trends, I mean the directional drift of a price trend that can be up, down, or sideways.
Many investors are probably wondering about the current trend of the U.S. stock market. So, I will share a quick observation since one of the most popular U.S. stock indexes seems to be right at a potential turning point.
Below is a 6 month price chart of the S&P 500 stock index. The S&P 500® is widely regarded as a gauge of large-cap U.S. equities. Clearly, prior to late August the stock index was drifting sideways. It was oscillating up and down in a range of 3% to 4% swings, but overall it wasn’t making material higher highs or lower lows. That is, until late August when it dropped about -12% below its prior high. Now, we see with today’s action the stock index is attempting reach or breach it’s very recent peak reached on August 27th. If the index moves above this level, we may consider it a short-term uptrend. We can already observe the index has made a higher low.
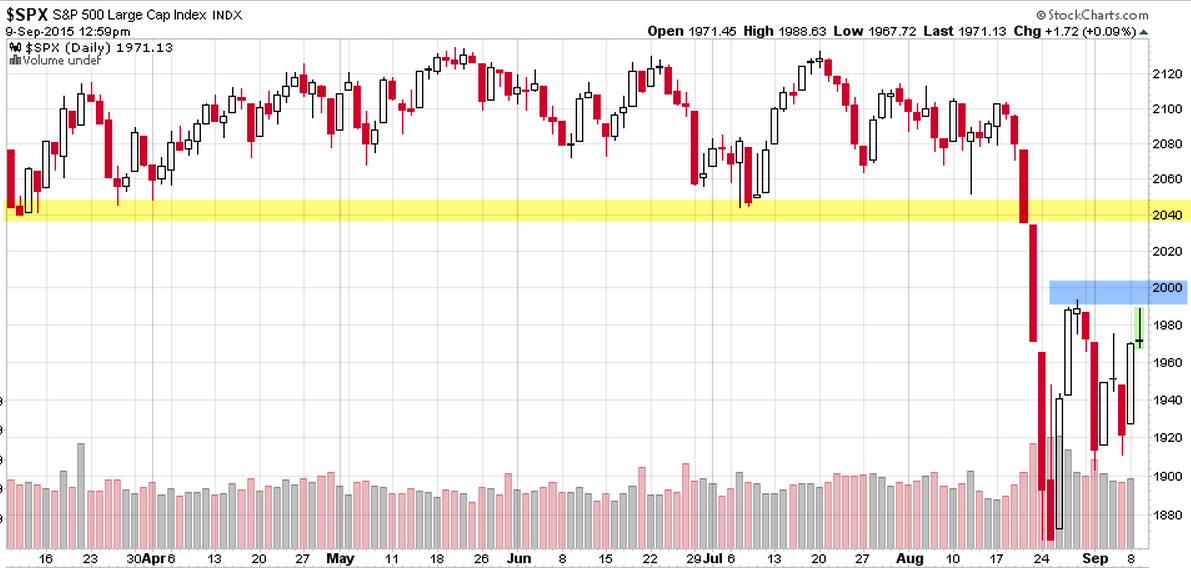
Source: Shell Capital Management, LLC created with http://www.stockcharts.com
You can probably see how the next swing will determine the direction of the trend. If it breaks to the upside, it will be an uptrend as defined by “higher highs and higher lows”. Although, that is a very short-term trend, since it will happen within a more intermediate downtrend.
My point is to observe how trends drift and unfold over time, not to predict which way they will go, but instead to understand and define the direction of “the trend”. And, there are many different time frames we can consider.
If this trend keeps going up, supply and demand will determine for how long and how far. If it keeps drifting up, I would expect it may keep going up until some inertia changes it. Inertia is the resistance to change, including a resistance to change in direction.
But if it instead goes back down to a new low, I bet we’ll see some panic selling driving it even lower.
The real challenge of directional price trends is if this is the early stage of a larger downward trend (like a bear market), there will be many swings along the way. In the last bear market, there were 13 swings that ranged from 10% to 27% as this stock index took about 18 months to decline -56%.
Below is the same stock index charted with a percentage chart to better show the percent changes over the past 6 months. You can probably see how it gives a little different perspective.
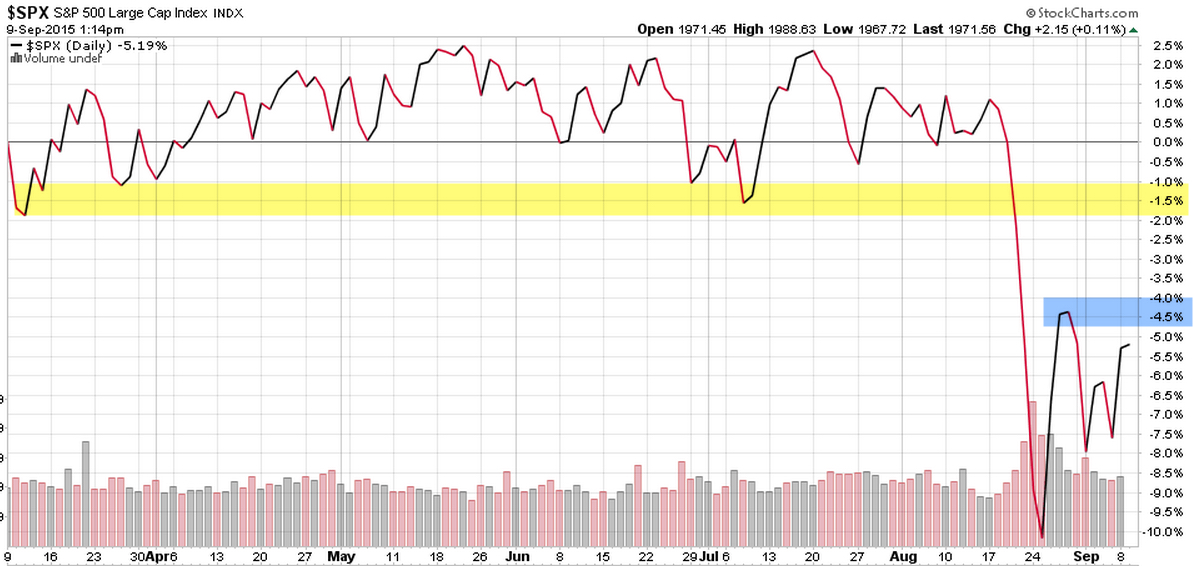
Source: Shell Capital Management, LLC created with http://www.stockcharts.com
I don’t necessarily make my tactical decisions based on any of this. I enjoy watching it all unfold and I necessarily need to define the trend and understand it as it all plays out. I want to know what the direction of the trend is based on my time frame, and know when that changes.
I believe world markets require active risk management and defining directional trends. For me, that means predefining my risk in advance in each position and across the portfolio.
______
For informational and educational purposes only, not a recommendation to buy or sell and security, fund, or strategy. Past performance and does not guarantee future results. The S&P 500 index is an unmanaged index and cannot be invested into directly. Please visit this link for important disclosures, terms, and conditions.

You must be logged in to post a comment.