Are We Entering a Civil War? Or Entering the Phase That Precedes It?

Are We Entering a Civil War? Or Entering the Phase That Precedes It?

The question keeps surfacing because something feels structurally different.

Not louder politics.
Not sharper rhetoric.

What people are sensing is a shift in how internal conflict is absorbed by the system.

Two independent, long-cycle frameworks help explain why this question is being asked now.

In The Changing World Order, Ray Dalio, founder of Bridgewater Associates, the world’s largest hedge fund, shows that escalating internal conflict is a recurring feature of late-stage debt and power cycles.

In The Fourth Turning Is Here, historians William Strauss and Neil Howe describe the same phase as a generational “Crisis” period—when existing institutions struggle to resolve new stresses.

Different lenses.
Same phase.

Civil Wars Don’t Start With Violence

History shows that civil wars are rarely the opening act.

They are the failure state—what happens after institutions lose the ability to mediate disagreement.

The conditions that tend to precede them include:

  • Loss of trust in institutions
  • Competing definitions of legitimacy
  • Zero-sum political incentives
  • Perceived unfairness in opportunity and outcomes
  • A belief that the rules no longer apply evenly

These conditions can persist for years without open conflict.

But once they stack, the system becomes fragile.

Escalating Conflict Is the Accelerator

Neither Dalio nor Strauss and Howe argues that internal conflict automatically leads to civil war.

They argue something more precise:

Internal conflict accelerates whatever comes next.

As it escalates:

  • Compromise becomes politically costly
  • Decision-making degrades
  • Rules lose legitimacy
  • Power replaces process

The system still functions—but with less shock absorption.

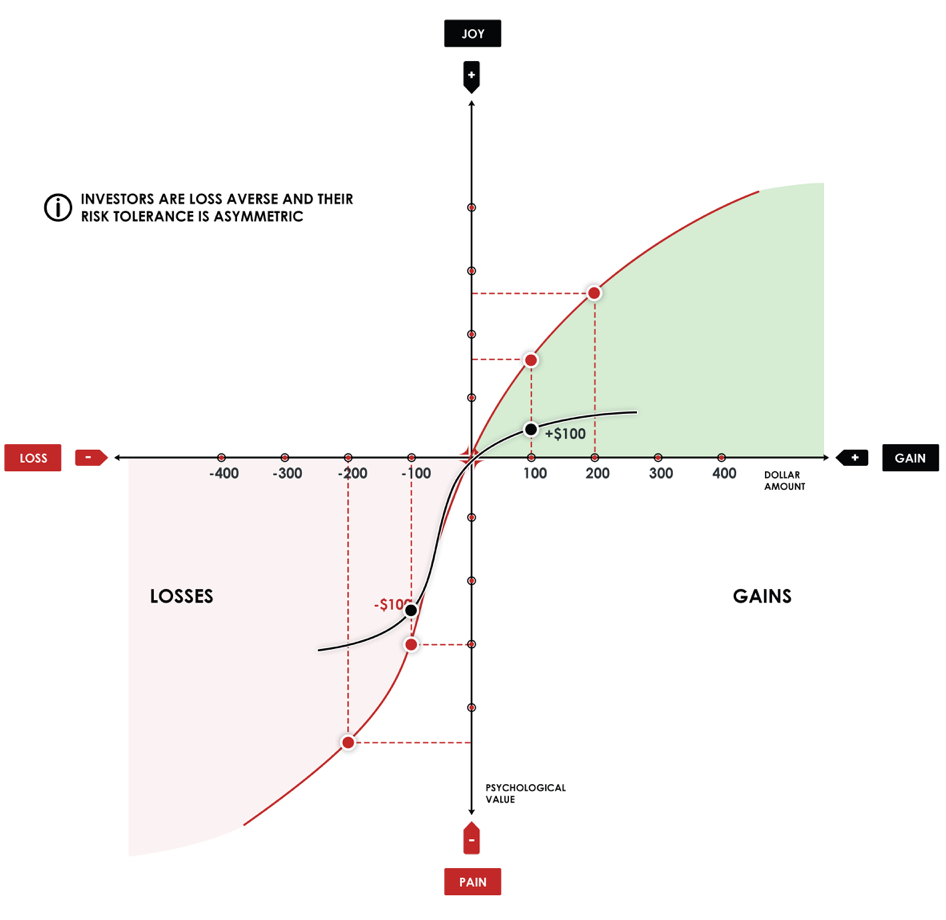
That’s where asymmetry appears.

Why This Phase Feels Unstable

Late-cycle conflict is nonlinear.

  • Stress builds quietly.
  • Confidence erodes gradually.
  • Then reactions become abrupt.

Small events provoke outsized responses.
Narratives harden.
Institutions lose the benefit of the doubt.

This doesn’t require violence to matter.

Markets, capital, and behavior reprice well before that.

The Real Risk Isn’t Civil War

The real risk is assuming stability is guaranteed.

Dalio’s work shows how internal disorder weakens empires financially and institutionally.
The Fourth Turning shows how generational pressure forces confrontation and restructuring.

Together, they imply:

  • Outcome distributions widen
  • Policy paths become discontinuous
  • Downside becomes heavier than models suggest

That’s negative asymmetry.

The ASYMMETRY® Perspective

This isn’t a prediction of civil war.

It’s a recognition of the phase.

Late-cycle systems don’t usually collapse overnight.
They lose resilience first.

They still operate.
Just with less margin for error.

Asymmetric risk management in this environment isn’t about forecasting the worst outcome.

It’s about designing exposure that survives multiple futures.

History doesn’t punish people for being cautious.

It punishes them for assuming the recent past is permanent.


Mike Shell is the Founder and Chief Investment Officer of Shell Capital Management, LLC, a registered investment adviser. He serves as portfolio manager of ASYMMETRY® Managed Portfolios, a separately managed account program with trade execution and custody provided by Goldman Sachs Custody Solutions.

The observations shared in ASYMMETRY® Observations are for general informational purposes only and do not constitute investment advice or a recommendation to buy or sell any security. The content is not intended to provide a complete description of Shell Capital’s investment process or strategies and should not be relied upon in making investment decisions.

Securities, charts, indicators, formulas, or examples referenced are illustrative in nature and are not intended to represent actual client holdings or recommendations. Past performance is not indicative of future results. Investing involves risk, including the potential loss of principal.

Any opinions expressed are subject to change without notice as market conditions evolve. All information is believed to be reliable but is not guaranteed and should be independently verified. Shell Capital Management, LLC provides investment advisory services only to clients pursuant to a written investment management agreement.

This material is not intended as an offer or solicitation for advisory services in any jurisdiction where such offer or solicitation would be unlawful.

When “Tax-Free” Isn’t Free — and When It Is

Asymmetry Observation: When “Tax-Free” Isn’t Free — and When It Is

Investors often assume tax-exempt money market funds are automatically superior for high-income clients.

They aren’t.

Not because tax efficiency doesn’t matter — it does — but because asymmetry lives in the math, not the label.

The decision isn’t about taxable vs. tax-free.
It’s about where the after-tax crossover actually occurs.

The Hidden Break-Even

According to Crane Data, the highest-yielding taxable money market funds are currently paying roughly 3.8%, while the top tax-exempt money market funds are closer to 2.2%.

That spread matters.

The question isn’t “Do I pay a lot in taxes?”
The question is:

At what marginal tax rate does 2.2% tax-free beat 3.8% taxable?

The math gives us the answer.

The break-even marginal tax rate is roughly 41%.

Below that level, taxable money funds still deliver more after-tax income.
Above that level, tax-exempt funds finally begin to dominate.

Why This Trips Investors Up

Most investors anchor on federal brackets.

But federal taxes alone usually aren’t enough to clear that hurdle.

Even at the top federal bracket, you’re still below the crossover point.

The advantage only appears when state taxes, surtaxes, and stacking effects push the all-in marginal rate high enough.

This is where asymmetry shows up.

Not in the headline yield.
Not in the product name.
But in how tax structure interacts with return structure.

This Is a Geometry Problem, Not a Preference Problem

Tax-exempt funds cap upside in exchange for certainty.

Taxable funds offer higher raw yield but introduce a tax drag.

The decision isn’t ideological.
It’s structural.

If your marginal tax rate is below the break-even point, choosing tax-exempt actually locks in a lower outcome. The certainty feels good — but the math is working against you.

Above the break-even point, the geometry flips. The tax drag overwhelms the yield advantage, and tax-exempt income becomes the asymmetric choice.

The Real Lesson

This isn’t about money market funds.

It’s about decision errors that come from labels instead of math.

“Asymmetric” doesn’t mean aggressive.
It means understanding where outcomes bend — and where they don’t.

Tax-free only becomes asymmetric after the crossover.

Before that, it’s just comfort masquerading as prudence.

And comfort has a very real opportunity cost.

As always, the edge isn’t found in avoiding taxes at all costs.
It’s found in knowing exactly when the structure changes — and positioning capital accordingly.


Mike Shell is the Founder and Chief Investment Officer of Shell Capital Management, LLC, a registered investment adviser. He serves as portfolio manager of ASYMMETRY® Managed Portfolios, a separately managed account program with trade execution and custody provided by Goldman Sachs Custody Solutions.

The observations shared in ASYMMETRY® Observations are for general informational purposes only and do not constitute investment advice or a recommendation to buy or sell any security. The content is not intended to provide a complete description of Shell Capital’s investment process or strategies and should not be relied upon in making investment decisions.

Securities, charts, indicators, formulas, or examples referenced are illustrative in nature and are not intended to represent actual client holdings or recommendations. Past performance is not indicative of future results. Investing involves risk, including the potential loss of principal.

Any opinions expressed are subject to change without notice as market conditions evolve. All information is believed to be reliable but is not guaranteed and should be independently verified. Shell Capital Management, LLC, provides investment advisory services only to clients pursuant to a written investment management agreement. This material is not intended as an offer or solicitation for advisory services in any jurisdiction where such offer or solicitation would be unlawful.

This commentary is provided for general informational and educational purposes only and does not constitute investment, tax, or legal advice, nor a recommendation or solicitation to buy or sell any security or investment product. The examples and calculations referenced are illustrative and are based on publicly available yield information at a specific point in time. Money market fund yields are variable and subject to change without notice.

Any fund names, yields, or tables shown are used solely for illustrative and educational context and do not represent an endorsement, recommendation, or ranking by Shell Capital Management, LLC. Tax-exempt status, tax treatment, and after-tax outcomes depend on individual investor circumstances, including but not limited to marginal tax rates, state and local tax laws, fund-specific tax characteristics, and holding structure. State taxation of municipal money market funds may differ based on fund composition and investor residency.

Shell Capital Management, LLC is a registered investment adviser. Registration does not imply a certain level of skill or training. All investment strategies involve risk, including the possible loss of principal. Past or current yield information does not guarantee future results. Investors should consult with their tax and financial professionals regarding their specific situation before making any investment decisions.

People Often Earn Money in One Business — Then Lose It in Another

One of the most common and costly patterns in private wealth has nothing to do with intelligence, effort, or ambition.

It has everything to do with asymmetry.

People often earn significant wealth in one profession or business—then lose a meaningful portion of it when they redeploy that capital somewhere else.

Not because they were reckless.
Not because they were uninformed.

But because the risk geometry changed, and they carried the wrong mental model with them.

The Core Principle

Wealth is usually created under one set of asymmetric conditions and lost under another.

Earning money and allocating capital are not the same skill.

Where Wealth Is Typically Earned

Across professions and businesses, wealth is most often created under favorable asymmetry:

  • Concentrated effort
  • Deep domain expertise
  • Control over decisions
  • Time arbitrage
  • Bounded losses with open-ended upside

This shows up clearly in:

  • Physicians, surgeons, and dentists building durable income streams
  • Business owners compounding enterprise value over decades
  • Entrepreneurs enduring volatility for a nonlinear exit

The common thread isn’t luck.

It’s structural asymmetry.

Where the Asymmetry Breaks

The break usually happens after the money is earned.

Professionals Investing Outside Their Field

We’ve seen highly successful physicians, surgeons, and dentists invest heavily in businesses they don’t operate.

They move from:

  • High control → low control
  • Transparent risk → opaque risk
  • Repeatable income → dependent outcomes

What looks like diversification is often concentrated, illiquid exposure with limited exit paths.

The upside is capped by deal terms.
The downside is uncapped by structure.

Business Owners After a Liquidity Event

We see the same pattern after a successful exit.

An owner sells a business they built and controlled—then:

  • Buys another business
  • Invests heavily as a passive partner
  • Starts something new with significant capital

The mistake isn’t ambition.

It’s the silent shift from operator to capital provider.

Control disappears.
Timing authority disappears.
Exit optionality disappears.

The asymmetry flips.

The Exit Lens (Our Framework)

Here’s the principle we use internally:

Every capital decision has an exit—explicit or implicit.

Most losses occur not because the opportunity was inherently bad, but because:

  • The exit wasn’t defined before entry
  • Liquidity was assumed instead of engineered
  • Timing depended on ideal conditions
  • Downside wasn’t structurally limited

Capital without an exit plan isn’t invested.

It’s exposed.

The ASYMMETRY® Perspective

Capital earned asymmetrically should be managed asymmetrically.

That means:

  • Defined downside before capital is committed
  • Optionality instead of obligation
  • Multiple exit paths, not one
  • Liquidity as a feature, not a hope
  • Structures designed to survive extraordinary periods

Whether you’re a professional investing outside your expertise or a business owner redeploying proceeds after a sale, the geometry matters more than the story.

A Quiet but Expensive Truth

Most fortunes aren’t lost where they’re made.

They’re lost when success creates confidence—and confidence replaces structure.

Earning money is about expertise.
Keeping it is about asymmetry.
Compounding it over a lifetime requires understanding the entire lifecycle of capital—from creation, to exit, to redeployment.

The exit doesn’t just determine the outcome of a business.

It determines what happens to everything that comes after.


Mike Shell is the Founder and Chief Investment Officer of Shell Capital Management, LLC, a registered investment adviser. He serves as portfolio manager of ASYMMETRY® Managed Portfolios, a separately managed account program with trade execution and custody provided by Goldman Sachs Custody Solutions.

The observations shared in ASYMMETRY® Observations are for general informational purposes only and do not constitute investment advice or a recommendation to buy or sell any security. The content is not intended to provide a complete description of Shell Capital’s investment process or strategies and should not be relied upon in making investment decisions.

Securities, charts, indicators, formulas, or examples referenced are illustrative in nature and are not intended to represent actual client holdings or recommendations. Past performance is not indicative of future results. Investing involves risk, including the potential loss of principal.

Any opinions expressed are subject to change without notice as market conditions evolve. All information is believed to be reliable but is not guaranteed and should be independently verified. Shell Capital Management, LLC provides investment advisory services only to clients pursuant to a written investment management agreement.

This material is not intended as an offer or solicitation for advisory services in any jurisdiction where such offer or solicitation would be unlawful.

Investors Own Capital. We Actively Manage Exposure

The distinction between investing and trading is misunderstood. 

Most of our clients call themselves investors.

That’s accurate.

They invest capital into our ASYMMETRY® Managed Portfolios with a long-term objective: preserve purchasing power, compound intelligently, provide income to live on, and avoid catastrophic mistakes.

What often causes confusion is what happens inside the portfolio.

Because while our clients are investors, their portfolios are actively managed in pursuit of asymmetric returns. 

That distinction matters.

Owning capital and managing exposure are two different roles.

When business owners hear the word “trading,” they often picture something they’d never tolerate in their own company: constant activity, short-term thinking, unnecessary risk, and decisions driven by noise instead of fundamentals.

That isn’t what we do.

We don’t day trade.
We don’t speculate on headlines.
We don’t buy and sell for activity’s sake.

What we do is make deliberate buy and sell decisions based on asymmetric risk/reward, trend, and market structure.

Our positions are typically held for weeks to months, sometimes longer, depending on conditions. Long enough for trends to matter. Short enough that capital is not trapped when risk changes.

That’s not gambling.
That’s management.

Most traditional investing frameworks assume something that business owners know isn’t true in real life: that once you make a good decision, you should leave it alone forever.


In business, you would never do that.

You don’t hire an executive, ignore performance, and hope for the best.
You don’t keep capital allocated to a failing division out of loyalty.
You don’t refuse to adapt when conditions change.

Markets are no different.

Capital that is never reassessed is capital that is unmanaged.

Our job is not to predict the future.

Our job is to continuously answer three questions on your behalf:

Are we being compensated for the risk we’re taking?
Is this exposure still working?
What happens if we’re wrong?

When the answers change, the portfolio changes.

That requires buying.
And it requires selling.

Not because we’re short-term thinkers, but because risk is dynamic.

Think of it the same way you think about owning a business or real estate.

You may be the owner, but you hire professionals to decide when to expand, when to reduce exposure, when to refinance, and when to exit.

No serious owner confuses activity with recklessness.
They understand that intelligent management requires decisions.

That’s how we approach portfolios.

Our clients invest with a long-term mindset.
We manage with a risk-first discipline.

They focus on outcomes.
We focus on exposure, asymmetry, and downside control.

That’s the difference between owning capital and stewarding it.

And in markets that move in cycles, regimes, and bursts — not straight lines — active management isn’t aggressive.

It’s responsible.


Mike Shell is the Founder and Chief Investment Officer of Shell Capital Management, LLC, a registered investment adviser. He serves as portfolio manager of ASYMMETRY® Managed Portfolios, a separately managed account program with trade execution and custody provided by Goldman Sachs Custody Solutions. The observations shared in ASYMMETRY® Observations are for general informational purposes only and do not constitute investment advice or a recommendation to buy or sell any security. The content is not intended to provide a complete description of Shell Capital’s investment process or strategies and should not be relied upon in making investment decisions. Securities, charts, indicators, formulas, or examples referenced are illustrative in nature and are not intended to represent actual client holdings or recommendations. Past performance is not indicative of future results. Investing involves risk, including the potential loss of principal.  Any opinions expressed are subject to change without notice as market conditions evolve. All information is believed to be reliable but is not guaranteed and should be independently verified. Shell Capital Management, LLC, provides investment advisory services only to clients pursuant to a written investment management agreement. This material is not intended as an offer or solicitation for advisory services in any jurisdiction where such offer or solicitation would be unlawful.

The Art of Asymmetric Investing Isn’t Balance — It’s Survival

The Art of Asymmetric Investing: When Imbalance Beats Balance

Most investors think the goal is balance.
Balanced portfolios. Balanced risk. Balanced returns.

It sounds prudent. It feels responsible.
And it’s often exactly how investors end up with the wrong kind of risk.

Because markets don’t reward symmetry. They punish it.

What business owner wants to balance their profit and loss? 

What investor wants to balance their risk and reward? 

We want the reward of profit and less risk and loss. 

That’s asymmetry, not symmetry. Imbalances, not balances. 

That’s the paradox.

Smooth returns often hide negative skew — many small gains punctuated by occasional, devastating losses. It’s the kind of profile that feels safe, works for a while, and quietly compounds fragility.

Asymmetry works the opposite way.

It’s uneven by design.
It accepts frequent small losses, boredom, and frustration in exchange for the one thing that matters: avoiding ruin while remaining exposed to outsized upside.

This is where most investors get it wrong.

Compounding is brutally asymmetric.

Large losses hurt far more than equivalent gains help. A 50% loss requires a 100% gain just to get back to even. That’s not an opinion — it’s arithmetic.

So the first job of any serious investment process isn’t maximizing returns.
It’s defining and controlling downside.

That’s the geometry of asymmetry.

Defined risk below.
Open-ended upside above.

Not because we’re predicting upside — but because we’re refusing to cap it.

This is why truly asymmetric strategies often look “wrong” for long stretches.

Trend-following looks broken until it isn’t.
Options with defined risk bleed until volatility arrives.
Convex payoffs disappoint until the environment changes.

And when it changes, they matter — fast.

The behavioral challenge is that positive asymmetry doesn’t reward patience evenly. It pays in bursts. That makes it hard to stick with, easy to abandon, and rare to execute well.

Most investors quit right before the payoff — not because the strategy stopped working, but because it didn’t feel like it was.

That’s not a strategy problem. It’s a discipline problem.

ASYMMETRY® isn’t about chasing alternatives, complexity, or exotic investments.
It’s about structuring exposure so outcomes matter more than forecasts.

We don’t need to know what will happen.
We need to know what happens if we’re wrong.

Balance tries to smooth outcomes.
Asymmetry tries to survive them.

And over full cycles, survival with optionality beats elegance every time.


Mike Shell is the Founder and Chief Investment Officer of Shell Capital Management, LLC, a registered investment adviser. He serves as portfolio manager of ASYMMETRY® Managed Portfolios, a separately managed account program with trade execution and custody provided by Goldman Sachs Custody Solutions. The observations shared in ASYMMETRY® Observations are for general informational purposes only and do not constitute investment advice or a recommendation to buy or sell any security. The content is not intended to provide a complete description of Shell Capital’s investment process or strategies and should not be relied upon in making investment decisions. Securities, charts, indicators, formulas, or examples referenced are illustrative in nature and are not intended to represent actual client holdings or recommendations. Past performance is not indicative of future results. Investing involves risk, including the potential loss of principal.  Any opinions expressed are subject to change without notice as market conditions evolve. All information is believed to be reliable but is not guaranteed and should be independently verified. Shell Capital Management, LLC, provides investment advisory services only to clients pursuant to a written investment management agreement. This material is not intended as an offer or solicitation for advisory services in any jurisdiction where such offer or solicitation would be unlawful.

Why Structural Change Doesn’t Guarantee Asymmetric Alpha

Just because sales and earnings are trending with velocity doesn’t necessarily mean the price trend of the stocks will follow.  Fundamental themes and trends can be right, but the asymmetric alpha is gone. 

The chart breaks U.S. retail sales into three categories over time: department stores, warehouse clubs, and e-commerce.

What it shows is structural, not cyclical.

Department store sales collapse from a meaningful share of retail spending to near irrelevance. Warehouse clubs gain share early, then plateau. E-commerce absorbs nearly all of the incremental consumer dollar.

That chart shows where consumer spending actually went.

If markets rewarded fundamentals directly, the trade would have been simple and persistent: long e-commerce, short brick-and-mortar retail.

For a time, that worked — when the shift was still uncertain and capital was misallocated.

Now look at the chart of the ETF price trends. It compares equity price trends for a long/short online-versus-stores retail strategy against broader consumer and market exposure. Despite e-commerce’s continued dominance in sales, the long/short retail trade stops compounding and is the opposite of relative strength. 

Nothing in the sales data reversed.
What changed was pricing.

That’s the asymmetry.

The first chart shows what changed in the economy.
The last chart shows when the market stopped paying for it.

Markets don’t wait for confirmation in the data. They anticipate it. By the time the sales shift became obvious, equities had already discounted it. The winners were fully owned. The losers were depleted. The spread that once existed had been arbitraged away.

This is where investors consistently go wrong.

They confuse structural truth with structural advantage.

A trend can remain intact for years and still stop producing excess returns once it becomes consensus. When uncertainty collapses, asymmetry disappears — even if fundamentals continue to trend in the same direction.

The ASYMMETRY® takeaway

Fundamentals explain the destination.
Prices are driven by the journey.

The opportunity exists only in the gap between the two.

Markets don’t pay you for being correct.
They pay you for being early — before the data proves it, before consensus forms, and before the asymmetry is consumed.

The price trend is the final arbiter. 

The first chart explains the theme.
The last chart explains the market.

Knowing the difference is the edge.

______________________

Mike Shell is the Founder and Chief Investment Officer of Shell Capital Management, LLC, a registered investment adviser. He serves as portfolio manager of ASYMMETRY® Managed Portfolios, a separately managed account program with trade execution and custody provided by Goldman Sachs Custody Solutions.

The observations shared in ASYMMETRY® Observations are for general informational purposes only and do not constitute investment advice or a recommendation to buy or sell any security. The content is not intended to provide a complete description of Shell Capital’s investment process or strategies and should not be relied upon in making investment decisions.

Securities, charts, indicators, formulas, or examples referenced are illustrative in nature and are not intended to represent actual client holdings or recommendations. Past performance is not indicative of future results. Investing involves risk, including the potential loss of principal.

Any opinions expressed are subject to change without notice as market conditions evolve. All information is believed to be reliable but is not guaranteed and should be independently verified. Shell Capital Management, LLC provides investment advisory services only to clients pursuant to a written investment management agreement.

This material is not intended as an offer or solicitation for advisory services in any jurisdiction where such offer or solicitation would be unlawful.

The Geometry of Asymmetry

Asymmetry isn’t a feeling.
It isn’t optimism.
It isn’t a story about why something should work.

It’s geometry.

Every investment decision draws a shape in space. That shape defines how much you can lose, how much you can make, and how outcomes compound over time. Most investors never look at the shape. They focus on narratives, forecasts, and averages. The geometry quietly does the damage.

Asymmetry starts with a simple question:
What does the payoff look like if I’m wrong versus if I’m right?

In asymmetric setups, downside is predefined and contained. Upside is open-ended or at least meaningfully larger than the loss. That imbalance isn’t philosophical—it’s mathematical. The slope of gains is steeper than the slope of losses. Over time, that geometry compounds in your favor.

Symmetric trades look harmless. They often feel “reasonable.” But their geometry is unforgiving. A 50% loss requires a 100% gain just to get back to even. That’s not bad luck. That’s math. The shape works against you even if you’re right half the time.

This is why forecasts don’t matter nearly as much as exits. The exit defines the left side of the geometry. If the left side is undefined, vertical, or ignored, the trade isn’t asymmetric—no matter how compelling the upside story sounds.

Great asymmetric decisions share a few geometric properties:

Losses are small, known, and survivable.
Gains are larger, variable, and allowed to run.
Position size is determined by the downside, not the upside.
Time works with the position, not against it.

When those conditions are present, you don’t need to be right often. You need to be wrong small and right big. The distribution does the heavy lifting.

This is also why most portfolios quietly fail. They’re built on expected returns and correlations, not payoff geometry. They assume stability. They assume time smooths outcomes. But volatility doesn’t average out—it compounds. Bad geometry compounds faster than bad luck ever could.

Asymmetry is the discipline of refusing bad shapes.

It’s choosing structures where errors don’t kill you and success doesn’t have a ceiling. It’s designing portfolios where survival is automatic and opportunity is optionality.

When you understand the geometry, behavior changes. You stop chasing certainty. You stop needing forecasts to be precise. You stop mistaking activity for edge.

You focus on the shape.
Because in markets, the shape always wins.

Mike Shell is the Founder and Chief Investment Officer of Shell Capital Management, LLC, a registered investment adviser. He serves as portfolio manager of ASYMMETRY® Managed Portfolios, a separately managed account program with trade execution and custody provided by Goldman Sachs Custody Solutions. The observations shared in ASYMMETRY® Observations are for general informational purposes only and do not constitute investment advice or a recommendation to buy or sell any security. The content is not intended to provide a complete description of Shell Capital’s investment process or strategies and should not be relied upon in making investment decisions. Securities, charts, indicators, formulas, or examples referenced are illustrative in nature and are not intended to represent actual client holdings or recommendations. Past performance is not indicative of future results. Investing involves risk, including the potential loss of principal.  Any opinions expressed are subject to change without notice as market conditions evolve. All information is believed to be reliable but is not guaranteed and should be independently verified. Shell Capital Management, LLC, provides investment advisory services only to clients pursuant to a written investment management agreement. This material is not intended as an offer or solicitation for advisory services in any jurisdiction where such offer or solicitation would be unlawful.

You Either Have an Edge — Or You’re Someone Else’s

You Either Have an Edge — Or You’re Someone Else’s

In every market transaction, someone has a structural advantage—and someone else is on the other side of it, often without realizing it.

That difference usually isn’t intelligence, effort, or credentials.
It’s whether the portfolio is built around a repeatable, disciplined edge, or whether it’s reacting to markets as they unfold.

Most investors believe they have an edge.
Very few actually do.

What an Edge Really Is

An edge isn’t a prediction.
It isn’t a hot tip, a strong opinion, or a conviction about what markets will do next.

A real edge is structural. It’s hard to replicate, grounded in economic or behavioral reality, and systematic enough to execute across full market cycles—not just the good parts.

At Shell Capital, our ASYMMETRY® framework looks at potential advantages through three simple lenses:

Positive Expectation: Does the approach have a rational, mathematical foundation that supports favorable outcomes over full market cycles—not just during strong markets?

Causal Foundation: Is it based on identifiable economic or behavioral forces, or is it just correlation dressed up as insight?

Real-World Execution: Can it actually be implemented once you account for volatility, drawdowns, costs, and the reality that investors are human?

If an approach doesn’t pass these tests, it may sound compelling—but it isn’t a durable investment discipline.

What a Durable Edge Looks Like In Business, Trading, and Investing

One useful way to think about edge comes from institutional research that studies why most strategies fail:

Useful Work: Markets reward participants who provide something of value—like liquidity during stress, risk absorption when others pull back, or discipline when emotions are running high.

Difficult Execution: If a strategy feels easy, comfortable, or emotionally satisfying in real time, it usually isn’t an edge.
Edges tend to require doing things that feel uncomfortable—and sticking with them longer than most people can.

Execution Discipline: Finding a potential advantage isn’t the hard part. Capturing it consistently, across changing market regimes and under pressure, is.

That’s where most approaches break down.

Why Most Investors Struggle

Most investors don’t operate with a defined investment discipline.

They chase what’s worked recently, abandon their process mid-cycle, and make decisions based on comfort rather than expectancy. Behavioral tendencies like recency bias, loss aversion, and capitulation during volatility aren’t random—they’re systematic.

And without a disciplined framework, portfolios often end up providing liquidity to more systematic participants, especially when markets are under stress.  

Why This Matters for Business Owners and Physicians

We’ve been advising business owners and physicians since the 1990s. If you’re a business owner or a physician, you’re usually not short on intelligence or effort—you’re short on time, attention, and tolerance for avoidable mistakes.

You’ve already taken concentrated risk to build what you have. Your wealth often isn’t the product of “average” decisions—it’s the product of a few big ones that worked. That’s also why the biggest threat usually isn’t missing the next rally.

It’s letting a meaningful portion of what you’ve earned get handed back through unmanaged drawdowns, forced decisions at the wrong time, or a portfolio that only works when markets cooperate.

Most high-income professionals don’t need more complexity. They need a portfolio that’s built around a simple reality: markets don’t send warnings before volatility expands, correlations converge, and the plan you thought you had gets tested.

That’s where disciplined risk management stops being academic and starts being personal.

The ASYMMETRY® Philosophy

At Shell Capital, everything starts with one idea: risk mitigation comes first.

Do no harm. 

We don’t rely on forecasts or market calls. We manage risk systematically.

That means:

Defined Risk: Before Return
Capital preservation and drawdown control come before return objectives.

Process Over Prediction: We manage portfolios across volatility regimes instead of guessing what markets will do next.

Portfolio-Level Risk Management: Risk is managed at the total portfolio level, not just position by position.

Systematic Exits: Every position has predefined exit criteria. Decisions are made before emotion enters the picture—not after.

Risk-Based Position Sizing: Capital is allocated based on risk, not conviction or narrative strength.

Our goal isn’t to outperform a benchmark in every environment.
It’s to pursue favorable asymmetric, risk-adjusted outcomes over full market cycles while avoiding the kinds of losses that permanently impair capital.

Everyone Has an Exit

I’ve been saying this since the 1990s:

Everyone has an exit.

It can be predefined and disciplined—or it can happen when the pain becomes too much and you tap-out.

Either way, the exit comes.

Portfolios without defined risk management don’t avoid exits. They just wait until markets or emotions force the decision.

We think that’s the wrong way to do it.

Discipline Beats Hope

Markets don’t reward hope, conviction, or comfort.
They reward preparation, discipline, and risk awareness.

Investors either operate with a systematic, risk-managed approach—or they’re taking more risk than they realize, especially when market conditions change.

At Shell Capital, our trademark ASYMMETRY® isn’t a slogan.
It’s a disciplined framework built around managing risk first and opportunity second.

Everything we do revolves around ASYMMETRY®; whether it’s exit planning to help an owner sell a business or managing the proceeds for retirement income, it’s all about the asymmetry of limiting the downside to unleash the upside. 

That discipline, applied consistently over time, is what we believe makes the difference.

___________________________

Mike Shell is the Founder and Chief Investment Officer of Shell Capital Management, LLC, a registered investment adviser. He serves as portfolio manager of ASYMMETRY® Managed Portfolios, a separately managed account program with trade execution and custody provided by Goldman Sachs Custody Solutions.

The observations shared in ASYMMETRY® Observations are for general informational purposes only and do not constitute investment advice or a recommendation to buy or sell any security. The content is not intended to provide a complete description of Shell Capital’s investment process or strategies and should not be relied upon in making investment decisions.

Securities, charts, indicators, formulas, or examples referenced are illustrative in nature and are not intended to represent actual client holdings or recommendations. Past performance is not indicative of future results. Investing involves risk, including the potential loss of principal.

Any opinions expressed are subject to change without notice as market conditions evolve. All information is believed to be reliable but is not guaranteed and should be independently verified. Shell Capital Management, LLC provides investment advisory services only to clients pursuant to a written investment management agreement.

This material is not intended as an offer or solicitation for advisory services in any jurisdiction where such offer or solicitation would be unlawful.

Connecting the Dots Means Understanding How Markets Interact

Most investors analyze markets in isolation.

Stocks. Bonds. Currencies. Commodities. Volatility. Options. Liquidity.
Each treated like a separate puzzle.

That’s not how markets actually work.

Markets are interacting systems, not independent variables.
Connecting the dots means understanding how pressure in one market transmits into another.

Equities don’t move alone.
They respond to rates.
Rates respond to inflation and growth expectations.
Volatility responds to uncertainty and positioning.
Options positioning feeds back into price through hedging mechanics.
Liquidity amplifies—or dampens—all of it.

Nothing is standalone.

When I say I “connect the dots,” what I’m really doing is mapping cause-and-effect relationships across markets:

  • How interest rate volatility alters equity risk premia
  • How volatility suppression changes investor behavior
  • How options flow creates feedback loops in price
  • How liquidity shifts turn small moves into large ones
  • How positioning converts information into forced action

This is why price alone is never enough.

The same price level can mean entirely different things depending on:

  • Volatility regime
  • Options positioning
  • Liquidity conditions
  • Trend maturity
  • Valuation context

That’s interaction, not observation.

Options flow matters because it shows where mechanical responses will occur.
Rates matter because they reprice all long-duration assets.
Volatility matters because it governs leverage, behavior, and forced selling.

And when those forces align, markets trend.
When they diverge, markets fracture.

Most investors ask, “What do I think the market will do?”
I’m asking, “If this moves, who is forced to act—and how does that propagate through the system?”

That’s how asymmetry is identified.

Connecting the dots isn’t about forecasting a single outcome.
It’s about understanding how markets interact under stress and opportunity and structuring exposure so upside is open while downside is defined.

That’s not a style.
That’s a framework.

And it’s how we navigate markets that are anything but simple.

___________

Mike Shell is the Founder and Chief Investment Officer of Shell Capital Management, LLC, a registered investment adviser. He serves as portfolio manager of ASYMMETRY® Managed Portfolios, a separately managed account program with trade execution and custody provided by Goldman Sachs Custody Solutions.

The observations shared in ASYMMETRY® Observations are for general informational purposes only and do not constitute investment advice or a recommendation to buy or sell any security. The content is not intended to provide a complete description of Shell Capital’s investment process or strategies and should not be relied upon in making investment decisions.

Securities, charts, indicators, formulas, or examples referenced are illustrative in nature and are not intended to represent actual client holdings or recommendations. Past performance is not indicative of future results. Investing involves risk, including the potential loss of principal.

Any opinions expressed are subject to change without notice as market conditions evolve. All information is believed to be reliable but is not guaranteed and should be independently verified. Shell Capital Management, LLC provides investment advisory services only to clients pursuant to a written investment management agreement.

This material is not intended as an offer or solicitation for advisory services in any jurisdiction where such offer or solicitation would be unlawful.

Autocorrelation Is Why Some Drawdowns Hit Harder Than Volatility Predicts

Autocorrelation Is Why Some Drawdowns Hit Harder Than Volatility Predicts

Autocorrelation measures whether investment returns are statistically related across time.
In plain English, it tells you whether losses tend to arrive randomly—or in clusters.

That distinction explains why some drawdowns feel survivable, while others feel devastating, even when traditional risk metrics look identical.

Most investors never examine this. They should.

The common misconception

Risk is volatility.
Control volatility, and drawdowns should be manageable.

That belief is built on a quiet assumption: returns are independent from one period to the next.

Markets rarely behave that way.

The first-principles correction

Returns have memory.

When returns are positively autocorrelated, losses tend to follow losses. Drawdowns deepen not because any single loss is extreme, but because losses arrive back-to-back, denying capital the chance to recover.

When returns are negatively autocorrelated, losses are more likely to be interrupted. Drawdowns are naturally shallower, even if volatility is unchanged.

Same average return.
Same volatility.
Completely different outcomes.

Why volatility understates drawdown risk

Most risk models assume independence and scale risk using square-root-of-time math.

That math breaks when returns are serially correlated.

Positive autocorrelation quietly magnifies downside risk without showing up in volatility, Sharpe ratios, or optimization outputs. This is why investors are often shocked by drawdowns that felt “statistically impossible” beforehand.

They weren’t impossible.
They were sequenced.

The geometry of asymmetry

Autocorrelation is not a nuance. It’s risk geometry.

Positive autocorrelation creates convex pain:

  1. losses stack
  2. recovery math worsens
  3. behavior deteriorates
  4. forced decisions increase

Negative autocorrelation introduces structural optionality

  1. losses are interrupted
  2. capital stays deployable
  3. recovery paths shorten
  4. downside asymmetry improves

This is why two strategies with similar long-term returns can feel radically different to live with—and why defining downside matters more than forecasting upside.

Boundary conditions and failure modes

Negative autocorrelation is not a free lunch. In persistent, one-directional markets it can lag.

Positive autocorrelation can feel powerful during strong trends—right up until regimes shift and losses begin clustering.

The failure occurs when investors mistake trend persistence for risk control.

If the downside isn’t explicitly defined, autocorrelation will define it for you.

Why this matters for high-net-worth investors

High-net-worth capital isn’t managed in spreadsheets. It’s managed through paths.

Drawdown depth and duration affect:

  • liquidity decisions
  • tax timing
  • behavioral discipline
  • redeployment opportunities

This is why two portfolios with similar long-term statistics can produce radically different real-world outcomes.

Volatility describes dispersion.
Autocorrelation determines damage.

Reinforcing conclusion

If you don’t understand how losses sequence, you don’t fully understand risk.

Asymmetry isn’t just about upside capture.
It’s about preventing losses from arriving in the worst possible order.

Define the downside.
Or the market will define it for you.


Mike Shell is the Founder and Chief Investment Officer of Shell Capital Management, LLC, a registered investment adviser. He serves as portfolio manager of ASYMMETRY® Managed Portfolios, a separately managed account program with trade execution and custody provided by Goldman Sachs Custody Solutions.

ASYMMETRY® Observations are provided for general informational and educational purposes only. They do not constitute investment advice, a recommendation, or an offer to buy or sell any security or investment strategy. The content is not intended to be a complete description of Shell Capital’s investment process and should not be relied upon as the sole basis for any investment decision.

Any securities, charts, indicators, formulas, or examples referenced are illustrative and are not intended to represent actual client portfolios, recommendations, or trading activity. Past performance is not indicative of future results. All investing involves risk, including the possible loss of principal.

Opinions expressed reflect the judgment of the author at the time of publication and are subject to change without notice as market conditions evolve. Information is believed to be reliable but is not guaranteed, and readers are encouraged to independently verify any information before making investment decisions.

Shell Capital Management, LLC provides investment advisory services only to clients pursuant to a written investment management agreement and only in jurisdictions where the firm is properly registered or exempt from registration.

True Asymmetry vs. False Asymmetry in Investment Management

Not all asymmetry is created equal.

Some strategies look asymmetric.
Others are.

The difference isn’t marketing. It’s geometry.

False asymmetry usually starts with a comforting story:

  • High probability of success
  • Small, steady gains
  • “Defined risk” on paper

It feels conservative. It feels smart. It feels controlled.

Until it isn’t.

False asymmetry is what happens when downside is underestimated, not eliminated.
When risk is capped in theory but not in reality.
When losses are rare — but devastating.

That’s not asymmetry. That’s deferred risk.

True asymmetry works in the opposite direction.

True asymmetry begins with explicitly defined downside — known in advance, sized intentionally, and survivable by design. From there, upside is left open, uncapped, and allowed to compound when conditions align.

Small risk.
Large optionality.
No illusions.

This distinction matters more than most investors realize.

Many strategies confuse probability with asymmetry.
They win often, until they don’t.
They feel safe, until volatility expands.
They monetize calm, and implode under stress.

True asymmetry doesn’t depend on being right frequently.
It depends on never being wrong in a way that matters.

That’s the difference between strategies that survive full market cycles — and those that disappear when conditions change.

For investors who already have “enough,” this distinction is critical.

At that point, the objective isn’t squeezing out incremental return.
It’s avoiding catastrophic loss while maintaining exposure to meaningful upside.

True asymmetry respects that.

False asymmetry ignores it — until markets enforce the lesson.

This is why we obsess over payoff structure, not narratives.
Why we define risk before seeking return.
Why we’re skeptical of anything that looks smooth, stable, and “too consistent.”

Because in markets, the most dangerous risks are often the ones that don’t show up until it’s too late.

True asymmetry isn’t exciting every day.
But it endures.

And over time, endurance is the edge that matters most.

__________

Mike Shell is the Founder and Chief Investment Officer of Shell Capital Management, LLC, a registered investment adviser. He serves as portfolio manager of ASYMMETRY® Managed Portfolios, a separately managed account program with trade execution and custody provided by Goldman Sachs Custody Solutions.

The observations shared in ASYMMETRY® Observations are for general informational purposes only and do not constitute investment advice or a recommendation to buy or sell any security. The content is not intended to provide a complete description of Shell Capital’s investment process or strategies and should not be relied upon in making investment decisions.

Securities, charts, indicators, formulas, or examples referenced are illustrative in nature and are not intended to represent actual client holdings or recommendations. Past performance is not indicative of future results. Investing involves risk, including the potential loss of principal.

Any opinions expressed are subject to change without notice as market conditions evolve. All information is believed to be reliable but is not guaranteed and should be independently verified. Shell Capital Management, LLC provides investment advisory services only to clients pursuant to a written investment management agreement.

This material is not intended as an offer or solicitation for advisory services in any jurisdiction where such offer or solicitation would be unlawful.

Captain Condor Blowup and the Illusion of Asymmetry

Having traded options for thirty years, I’ve seen the same pattern repeat across decades and market regimes: what looks like consistency is often just risk being deferred.

A recent MarketWatch article, “I experienced a catastrophic financial loss’: How options trader ‘Captain Condor’ led his followers to a $50 million wipeout”, details how an options trader known online as “Captain Condor” led a large group of followers into a catastrophic loss estimated at around $50 million in late December.

The strategy centered on selling short-dated iron condors on the S&P 500—a trade that profits when the market stays within a narrow range. For long periods, the approach generated frequent small gains and appeared highly consistent.

The critical flaw was position sizing.

After losses, exposure was increased using a Martingale-style approach, effectively doubling down in an attempt to recover prior losses. When market conditions shifted during a low-liquidity holiday period and volatility collapsed, the group placed an extremely large final trade.

That trade failed.

Many participants lost a substantial portion — in some cases most — of their invested capital in a matter of days. The article highlights that the market itself finished near record highs, reinforcing that the losses were driven by risk structure, not a market crash.

The Strategy That Worked… Until It Didn’t

What struck me wasn’t the strategy itself.

It was the illusion of asymmetry.

On the surface, everything looked responsible:
defined-risk option spreads,
high win rates,
and a steady stream of small gains.

That combination is seductive — especially to investors who value consistency.

But asymmetry isn’t defined by how a strategy behaves most of the time.

It’s defined by what happens when the market stops cooperating.

Smooth returns are often borrowed from the future

The strategy sold short-dated option premium.
That works exceptionally well… until it doesn’t.

Selling volatility is like collecting insurance premiums:
you get paid frequently,
right up until the claim arrives.

The smoother the return stream,
the more likely risk is being deferred rather than eliminated.

True asymmetry embraces variability.
False asymmetry hides it.

Defined risk per trade does not mean defined risk overall

Each individual trade had a capped loss.

The portfolio did not.

When losses occurred, position sizes increased in an effort to “get back to even.”

That single decision inverted the entire risk profile.

Risk expanded after losses instead of contracting.
Exposure increased when capital was already impaired.

That is the opposite of asymmetry.

In asymmetric systems, losses trigger smaller risk, not larger bets.

Probability is not protection

The strategy was marketed as having a “vanishingly small” chance of catastrophic loss.

That phrase should always raise concern.

Markets don’t resolve risk based on probability.
They resolve it based on path.

If a strategy cannot survive a rare outcome,
it is not asymmetric —
it is fragile.

Asymmetry doesn’t ask,
“How likely is this?”

It asks,
“What happens if it does?”

Consistency is not the goal — survival is

The most dangerous strategies in finance are the ones that work reliably for a long time.

They condition investors to expect stability.
They train behavior that assumes tomorrow will look like yesterday.

Asymmetric strategies assume regimes change.
They plan for discontinuity.
They define exits before they’re needed.

This strategy depended on the market staying inside a narrow range,
and on losses being temporary.

That assumption eventually failed — as it always does.

The real lesson

This wasn’t a failure of options.
It wasn’t a failure of retail traders.
It wasn’t even a failure of volatility selling.

It was a failure to respect asymmetric risk.

The downside was larger than it appeared.
The recovery path required increasing exposure.
The terminal outcome was unavoidable.

Asymmetry isn’t about avoiding losses.

It’s about never allowing one outcome to end the game.

Any strategy that trades consistency for fragility is not asymmetric—no matter how calm it looks on the way up.

Why Nassim Nicholas Taleb Says Most “Alpha” Isn’t Real

Why Nassim Nicholas Taleb Says Most “Alpha” Isn’t Real

Nassim Nicholas Taleb is a former options trader, hedge fund manager, and risk researcher best known for The Black Swan, Fooled by Randomness, and Antifragile. His work focuses on one central idea: risk is not about averages — it’s about survival. Taleb’s perspective is unusual because it doesn’t come from traditional finance academia. It comes from trading, probability theory, and real-world exposure to tail events that permanently destroy capital.

In a Bloomberg interview, Taleb revisits a point that is critically important for high-net-worth business owners and investors — and still widely misunderstood.

The short version:
Most investment strategies are built on the wrong kind of probability.

The mistake: confusing averages with survival

Taleb explains that modern finance largely relies on ensemble probability—outcomes averaged across many hypothetical investors at a single point in time. In that framework, one investor’s failure doesn’t matter. If Investor #29 goes bankrupt but Investor #30 survives, the model keeps going.

But real investors don’t experience markets that way.

Real capital compounds through time. If you go bankrupt or suffer a large forced reduction—through leverage, margin calls, panic selling, or liquidity needs—the next period doesn’t occur, or it occurs on permanently impaired capital. The path is broken.

This distinction sounds academic, but it has very practical consequences.

A strategy can look attractive on paper—strong returns, solid “alpha,” good backtests—while quietly carrying a small probability of catastrophic loss. Over time, that small probability isn’t small at all. It’s just a matter of when.

Why real practitioners think differently

Taleb points out that seasoned practitioners intuitively understand this, even if they don’t express it mathematically. He cites investors like Warren Buffett and Ray Dalio—people whose first rule is not maximizing returns but avoiding ruin.

Buffett has said, in essence:

I don’t want a small probability of a big loss. I want zero.

That mindset doesn’t come from business school. It comes from understanding that time is the real asset. Once it’s gone, no future opportunity can fix it.

The uncomfortable truth about downside protection

One of the most important moments in the interview comes when Bloomberg notes that reducing the probability of ruin to near zero is not cheap. Taleb agrees.

Downside protection has a cost:

  • defined exits limit upside in some markets
  • hedging can create drag during calm periods
  • leverage must be constrained

But Taleb’s point is sharp:
If a strategy only looks attractive before you price in survival, then the alpha was never real to begin with.

Many strategies generate returns by implicitly selling insurance against rare but severe losses. When that tail risk is removed, the apparent alpha shrinks. What remains is smaller—but realizable. It can actually compound through time.

Alpha that cannot survive the path is not alpha.

Ruin doesn’t mean zero

Taleb also makes a crucial point that resonates strongly with high-net-worth business owners: ruin is personal.

Blowing up doesn’t require losing everything.

For a successful entrepreneur in their 50s or 60s, a permanent 30% capital depletion can fundamentally alter:

  • retirement income
  • lifestyle expectations
  • legacy planning
  • decision-making under stress

That is an “uncle point”—a threshold beyond which recovery is no longer realistic or acceptable, even if the investment portfolio technically survives.

Most investors overestimate how far away that tap-out point really isuntil they experience it.

How this connects to ASYMMETRY®

This interview articulates, in plain language, the foundation of our ASYMMETRY® approach.

 ASYMMETRY® Managed Portfolios aren’t designed to optimize averages. They are designed to preserve the ability to keep playing.

It means:

  • downside is defined first, by determining in advance the price we’d exit if we’re wrong 
  • position size is determined by the distance between the entry price and stop loss 
  • total portfolio risk is managed actively
  • upside remains open, but only within survivable boundaries

The objective is not the highest theoretical return.
It is the highest probability of long-term compounding without crossing irreversible thresholds.

Because wealth isn’t built by models that assume you get infinite retries.
It’s built by investors who survive the path.

Why this matters now

Markets periodically reward risk-taking that ignores ruin—until they don’t. When volatility returns, the difference between strategies built on averages and those built on survival becomes obvious very quickly.

Taleb’s warning is not pessimistic. It’s practical.

And for people who spent decades building their capital, practicality matters more than theory.

Watch the full interview: Nassim Taleb on the Importance of Probability 

Markets Aren’t Driven by Averages

Markets aren’t driven by averages

Most investment frameworks still assume markets are driven by rational actors optimizing long-term averages.

They aren’t.

Markets are driven by how humans perceive gains, losses, and risk in real time—and that perception is systematically distorted under pressure.

This isn’t speculation. It’s formalized in Prospect Theory, the Nobel Prize-winning framework developed by Daniel Kahneman and Amos Tversky that explains how people actually behave when real money is on the line.

The asymmetry is structural

Prospect Theory demonstrates investors are:

  • Risk-averse when they’re winning
  • Risk-seeking when they’re losing
  • Far more sensitive to losses than to equivalent gains

This creates a non-linear value function centered around a reference point—usually “break-even.”

In markets, that behavioral asymmetry shows up as:

  • Upside trends that persist longer than expected
  • Downside moves that accelerate faster than models assume
  • Volatility that clusters rather than distributes smoothly

Averages don’t explain that. Behavior does.

Where wealth gets destroyed

Here’s the problem most investors don’t see coming:

The gap between how portfolios are constructed and how humans actually behave under pressure is where wealth gets destroyed.

Not by market risk. By behavioral risk.

Modern Portfolio Theory assumes you’ll hold through any drawdown. Prospect Theory explains why you won’t—and why trying to force yourself to will likely make things worse.

Loss aversion intensifies as drawdowns deepen. Investors lock in gains too early when winning and hold losses too long trying to “get back to even.” The discipline you think you have evaporates precisely when you need it most.

That’s not a character flaw. It’s human wiring.

From behavior to process

Prospect Theory doesn’t predict what markets will do next. It explains how people react once markets move.

That distinction is critical.

At Shell Capital, we design systems around that reality:

  • Downside risk is defined in advance, before loss aversion takes over
  • Exits to limit losses are systematic, not emotional
  • Upside is allowed to compound when trends persist
  • Position sizing reflects asymmetry, not averages

We don’t optimize for theoretical means. We manage the path—how returns are experienced over time.

Because the path is what determines whether you stay invested or tap out.

The practical reality

You can’t behavior-modify your way out of loss aversion. You can only design around it.

Markets aren’t driven by averages—they’re driven by how humans perceive gains, losses, and risk under pressure.

Our systems are built to harness that asymmetry while protecting against the behavioral traps that destroy even well-intended investment plans.

That’s where disciplined risk management begins.

Does your portfolio account for behavioral risk?

At best, portfolios may be stress-tested for market scenarios—2008, COVID, rate shocks.

Almost none are stress-tested for the investor.

One of the many parts of ASYMMETRY® is a behavioral risk diagnostic that maps allocations against asymmetries that emerge under pressure:

  • Where loss aversion is likely to override discipline
  • Which positions create unintended behavioral exposure
  • How your exit strategy (or lack of one) amplifies downside risk
  • Whether your position sizing reflects asymmetry or just diversification

If you want to see how your portfolio holds up under behavioral stress, contact us and we’ll send you the framework and walk you through how we apply it to your current holdings.

—Mike Shell President & Chief Investment Officer Shell Capital Management, LLC

ASYMMETRY® Artificial Intelligence in Decision Systems

Every portfolio is the result of a decision system.

Not a single decision — but a chain of them. When to enter. When to reduce risk. When to exit. When to do nothing. Over time, these decisions matter far more than any individual position.

ASYMMETRY® Artificial Intelligence exists to improve the quality of those decisions — not by making them for us, but by improving the environment in which they are made.

Decision systems fail in predictable ways.

They react too slowly to changing conditions.
They react too quickly to noise.
They overweight recent information.
They underweight risk until it’s obvious.

AI helps correct these tendencies by continuously processing information humans cannot reliably synthesize in real time.

It doesn’t decide what to do.
It clarifies what is changing.

That distinction is critical.

ASYMMETRY® Artificial Intelligence highlights when volatility shifts from benign to hostile, when trends lose dominance, when exposure accumulates unintentionally, and when inaction itself becomes a risk.

By improving situational awareness, AI allows human judgment to operate where it belongs: at the policy and accountability level, not at the reflex level.

This is especially important for decision-makers managing complex portfolios across multiple strategies and market regimes. The more complex the system, the more fragile intuition becomes.

AI restores balance by grounding decisions in rules, thresholds, and structure rather than emotion or narrative.

Good decision systems don’t seek certainty.
They seek survivability, adaptability, and consistency.

ASYMMETRY® Artificial Intelligence strengthens all three.

It doesn’t promise better predictions.
It delivers better decisions over time.

And that is where asymmetric advantage actually comes from.

The Exit, Not the Entry, Always Determines the Outcome

Having tactically traded through the 1998 Russian crisis and LTCM collapse, the dot-com bubble and crash, the 2007–09 financial crisis, the COVID shock, and everything since, Mike Shell has seen it all.

And one thing never changes:
every bull market brings out a new crowd of investors showing off their “big winners.”

They’ll post screenshots of a stock that’s doubled or tripled, pat themselves on the back, and make it sound like this game is easy.

But here’s the thing:

  • They’re probably leaving off the losers.
  • They don’t mention the stocks they sold for a loss — or worse, the ones still sitting deep in the red.
  • And those open profits they’re bragging about? They’re not their money yet. They’re still the market’s money until they sell.

If they don’t lock it in, the market can take it all back — and it often does. That’s not portfolio management, that’s just riding the trend. But trend following requires more than just following the trend — capturing a trend requires selling when it ends. 

“The trend is your friend until the end, when it bends.” – Ed Seykota

At Shell Capital, we operate a complete system, and a complete system necessarily requires an exit to realize profits. 

It’s What You Do After You Buy That Makes All The Difference 

Most people think investing success is about picking the right stock. Finding the right entry is nice — but that’s just the start.

“The exit, not the entry, always determines the outcome. The exit determines if you win or lose, and how much you win or lose.” — Mike Shell

That’s why ASYMMETRY® is built on a process, not hunches. We’re not just buying stocks that go up — we’re managing risk and reward across the entire portfolio.

The ASYMMETRY® Portfolio Management Process

Our goal is to produce asymmetric returns — smaller losses, bigger potential gains — through disciplined decisions. 

Here’s what that really looks like:

1. What to Buy

We don’t chase tips, memes, or headlines. We systematically select ETFs, stocks, and other instruments with asymmetric risk/reward potential using our systems for entry and exit.

2. When to Sell a Loser

Before we ever enter a position, we know where we’ll exit if it goes against us. That’s how we size the position. Cutting losses is step one in protecting capital.

3. How Much to Buy

We size every position based on risk, not conviction. That keeps one trade from blowing up the portfolio.

4. When to Sell a Laggard

If a position stops trending, loses momentum, or isn’t keeping up with the opportunities we see elsewhere, we rotate the capital into something stronger.

5. When to Sell a Winner

Open profits are just unrealized gains. We take gains systematically — either with trailing stops or by trimming into strength — so winners actually add to portfolio compounding. 

Why it Matters

A lot of investors think their biggest problem is “picking better stocks.” But no one knows for sure in advance which stocks will be better, or profitable. It’s always probabilistic, never a sure thing.

The truth is, their problem is they don’t have a system for what to do after they buy.

Portfolio outcomes are driven by what happens next — how you manage risk, when you take gains, and how you keep losers from getting too big.

That’s why ASYMMETRY® is more than just buying stocks that go up. It’s a complete system designed to turn market trends into realized, asymmetric results — not just paper gains.

“Everyone has an exit; it can be predefined like ours, or when you reach your tap-out point. Either way, you decide it.” – Mike Shell

VIX Term Structure: The Hidden Edge in Market Complacency

The VIX futures curve is sending a clear signal—one that’s easy to misread without a sharp eye.

Right now, the curve slopes sharply upward in steep contango: near-term VIX futures trade significantly below longer-dated contracts. This structure screams one thing: market complacency. Investors expect volatility to stay muted in the short term, with only a gradual rise over time. Hedging demand is low, carry trades are thriving, and the market is betting on smooth sailing.

But beneath this calm lies a powerful asymmetry—a coiled spring of risk.

The Setup: Complacency Breeds Fragility

Contango reflects a market lulled into a sense of security. As of August 4, 2025, the spot VIX hovers around 19–20, with August VIX futures near 19.75 and longer-term contracts pricing even higher volatility. This curve shape aligns with a broader narrative of stability, where short-volatility strategies profit from the volatility risk premium—investors consistently overpaying for distant protection.

Contango dominates roughly 80% of the time, but that dominance creates fragility. When markets are positioned for stability, any unexpected shock—geopolitical flare-ups, CPI surprises, Fed missteps, or liquidity cracks—can ignite a volatility spike. We saw this play out in April 2025, when the VIX surged past 60, flipping the curve into backwardation and repricing volatility risk across the board. By July, calm returned and the curve normalized—delivering over +35% gains to inverse-volatility strategies like SVIX.

The Asymmetry: Nonlinear Payoffs

Here’s where the edge lies: volatility doesn’t just rise—it explodes.

When complacency is wrong, the repricing isn’t linear. Traders scramble to hedge, short-vol positions get forcibly unwound, and the curve can invert in hours. This creates convex, nonlinear upside for long-volatility exposures—whether via call options on VIX, structured hedges, or ETPs like VXX.

These long-vol trades act like cheap insurance with explosive optionality. They offer small controlled cost and defined downside, with the potential for outsized payoffs when stress hits the system. That’s the asymmetric risk/reward profile that most investors ignore—until it’s too late.

Watch for leading signals. Metrics like VVIX (the volatility of volatility) and flattening in the front end of the curve can offer early warnings. These subtle shifts—seen briefly in June—suggest market makers are quietly preparing for turbulence before it becomes obvious.

The Edge: ASYMMETRY® Thinking

This isn’t about guessing the next shock.

It’s about structuring the portfolio for payoff asymmetry—preparing in advance for when the odds become skewed in your favor.

The current steep contango presents two paths:

  • Exploit the carry: When calm persists, shorting volatility (via SVIX, short VIX futures, or options overlays) can capture steady return from negative roll yield.
  • Prepare for the spike: When complacency is mispriced, long-volatility trades can deliver convex payoffs that hedge downside and capitalize on regime shifts.

At Shell Capital, we engineer both sides of this equation. We don’t rely on forecasts—we structure portfolios to adapt, with total portfolio risk exposure limits, predefined exits, and asymmetric hedges in place.

The Bottom Line

  • A steep VIX futures curve signals calm—but that calm can be fragile
  • Volatility spikes are reflexive and nonlinear—rewarding those positioned with asymmetric payoff structures
  • ASYMMETRY® means focusing not just on what the market expects, but where it may be wrong.

In today’s uncertain environment, don’t just ride the calm.

Prepare for the storm.

Because when risk is least expected, the payoff is most asymmetric.

Why Is the Stock Market Down Today? (August 1, 2025)

Why Is the Stock Market Down Today? (August 1, 2025)

The stock market is trading lower today as a mix of weak economic data, aggressive new tariffs, and stretched valuations shake investor confidence.

1. Weaker-than-expected Jobs Report

The July jobs report significantly underperformed expectations—only 73,000 new jobs added, far below forecasts. Additionally, there were sharp downward revisions totaling 258,000 jobs for May and June. The unemployment rate ticked up to 4.2%. These developments raised concerns about a slowing economy and pushed traders to price in possible Federal Reserve interest rate cuts as early as September. Read full coverage at The Wall Street Journal and More from Investors.com

2. New Tariff Announcements

President Trump announced sweeping new tariffs taking effect around August 7. These include:

  • 39% tariffs on Swiss imports
  • 35% tariffs on non‑compliant Canadian goods
  • 25% tariffs on Indian goods

This sharp escalation in trade protectionism has increased fears of rising input costs, supply chain disruptions, and a global growth slowdown. Full breakdown via Investopedia

3. Valuation and Sentiment Concerns

Forward price-to-earnings ratios have climbed above 22.5×, with some market strategists—such as Kevin Muir of The Macro Tourist—noting that positive earnings news may already be fully priced in. With August historically a weak seasonal month, sentiment has shifted more defensively. Analysis via MarketWatch

Other Factors Pressuring the Market

  • Tariffs Are Now Active
    Executive orders were implemented today, introducing widespread duties on imports. These moves are intended to correct trade imbalances but are adding inflationary pressure and margin uncertainty. More background here
  • Labor Market Slump
    The latest report signals a slowing job market, and the significant revisions downward to previous months confirm the trend. Investors are watching closely to see if consumer demand begins to weaken.
  • Reduced Risk Appetite
    Lower Treasury yields, a declining U.S. dollar, and easing equity volatility all point to a rotation away from risk-on assets. Traders appear to be selling strength, not buying dips.

Summary Table

Market Driver Why It Matters
Weak Jobs Growth Indicates potential economic slowdown and increases rate cut odds
Escalating Tariffs Raises risks to corporate margins and global trade stability
High Valuations Limited room for upside surprises or disappointments
Seasonal Patterns August has historically been a volatile and weaker month

What to Watch Next

  • Upcoming economic reports: ISM Manufacturing PMI, Services PMI, and University of Michigan Consumer Sentiment
  • Forward earnings guidance: Especially from consumer and industrial companies that may be impacted by tariffs
  • Federal Reserve positioning: Watch for speeches or commentary hinting at September rate action

Volatility, policy shifts, and valuation extremes demand more than passive investing. This is when active risk management and asymmetric positioning matter most.

S&P 500 Dividend Yield Hits Multi-Decade Low: What It Means for Asymmetric Investors

The S&P 500 Dividend Yield Has Collapsed—Here’s Why It Matters for Asymmetric Risk/Reward and Asymmetric Returns 

The S&P 500 dividend yield has dropped to 1.25%, one of the lowest readings in more than two decades. That’s 31% below its long-term average of 1.81% and just a hair above its historical low of 1.12%.

This may seem like a minor detail—but it’s not. Dividend yield isn’t just about income. It’s a signal of valuation, investor psychology, and risk appetite. And right now, it’s flashing a warning.

 What Low Yield Really Tells Us

  1. Valuations Are Elevated
     Dividend yield falls when prices rise faster than dividends. Today’s 1.25% yield suggests investors are paying historically high multiples for future earnings—despite tightening financial conditions and macro uncertainty.
  2. The Income Cushion Is Gone
     In past decades, a 2–3% dividend yield helped buffer drawdowns. With today’s 1.25% yield, investors are accepting full equity market risk for a historically low income stream.
  3. Asymmetry Has Flipped Against You
     During past market shocks—like 2008 or March 2020—dividend yields spiked. That wasn’t because companies paid more—it was because prices dropped. Those were moments of positive asymmetry: high potential upside, low downside after a flush. Today, we’re on the opposite end: low income, high valuation risk, limited cushion.

 The ASYMMETRY® Perspective

At Shell Capital, we don’t accept poor asymmetry. We focus on structuring portfolios where the downside is predefined and limited, and the upside is open-ended and potentially exponential.

That means we actively manage risk, monitor market regimes, and adapt portfolio exposures rather than ride passive beta into valuation extremes. We don’t believe in chasing stretched markets just because “that’s what the index does.”

Instead, we believe in engineered asymmetry—seeking trades and positioning where the reward dramatically outweighs the risk, not the other way around.

 The Bottom Line

  • S&P 500 dividend yield is near historic lows at 1.25%
  • This reflects elevated prices and compressed forward return potential
  • Passive investors today are assuming full downside risk for minimal income
  • This environment lacks the positive asymmetry we demand in our strategies

If your portfolio relies on the S&P 500 stocks for income or long-term compounding, it’s time to reassess. This setup offers low yield, stretched valuations, and little room for error.

That’s not asymmetry. That’s risk without reward.

Shell Capital pursues asymmetric investment returns by predefining risk and managing exposure dynamically across market regimes.

 If you’re ready to rethink risk, we’re ready to help.

Asymmetric Returns Don’t Come from a Margin of Safety —They’re Engineered Through Structure

Asymmetric Returns Don’t Come from a Margin of Safety —They’re Engineered Through Structure

Many investors confuse optimism with asymmetry. They assume that if a stock is “undervalued” or “can’t possibly go lower,” it must offer limited downside and substantial upside.

We’ve been seeing articles published claiming some stock or even crypto offers an “asymmetric risk/reward solely based on their assumptions of valuation. It sounds appealing—but it’s not asymmetric investing.

It’s speculation dressed up in narrative.

At Shell Capital, we don’t rely on gut feeling or valuation assumptions to pursue asymmetric returns.

We structure them.

The Fallacy of “It Can’t Go Lower”

Just because a stock looks cheap on a price chart or by a valuation metric doesn’t mean the downside is limited. Markets don’t operate on fairness or logic. They operate on supply and demand, momentum, liquidity, and reflexivity.

  • In the 90s, Enron looked undervalued—until it became worthless.
  • In 2008, Lehman Brothers looked like a bargain—until it went bankrupt.
  • Countless biotech stocks looked like they “couldn’t go lower”—until they did.

An investor saying, “This stock is down 70%; how much worse can it get?” is expressing hope, not strategy. The truth is, a stock that’s down 70% can still go down another 100% from here. If it drops to zero, the percentage loss from any entry point is still absolute.

In other words, you don’t get asymmetric returns by assuming the downside is limited. You get asymmetric returns by structuring the downside.

What Creates an Asymmetric Return Profile?

At Shell Capital, we define asymmetric risk/reward and asymmetric returns as limited and predefined downside, with potentially unlimited or exponential upside.

That doesn’t come from the asset—it comes from how the position is constructed.

There are three essential ingredients:

  1. Predetermined Risk Control (Defined Downside):
    We don’t “hope” a position won’t go down. We engineer it so that if it does, the damage is strictly limited—via:
    • ATR-based or technical stop-loss levels
    • Options strategies with defined max loss (e.g., call spreads or put hedges)
    • Sizing the position based on how much we are willing to risk (e.g., 1% of total portfolio capital)
  2. Uncapped or Convex Upside Potential:
    Asymmetry comes when the upside is not only greater than the downside but potentially disproportionate, for example:
    • Trending stocks after breakouts
    • Option trades with skewed risk/reward profiles
    • Pyramiding into strength while trailing exits locks in gains.
  3. Dynamic Portfolio Risk Management:
    Even a well-structured asymmetric trade can become a portfolio liability if it’s one of many undisciplined positions. That’s why we:
    • Monitor portfolio heat (total open risk across all trades)
    • Adjust exposure as volatility regimes shift
    • Hedge with volatility or inverse strategies when risk rises systemically

Structure Beats Story

Asymmetric returns aren’t born from a compelling story about a company. They’re not created because a CEO sounds confident on CNBC. And they certainly don’t emerge just because a stock has fallen far enough to “feel safe.”

Asymmetric returns come from decisions made before the trade is even placed:

  • Where will we exit if we’re wrong?
  • How much capital are we risking?
  • Is the potential gain a multiple of that risk?
  • How does it fit into our overall portfolio heat and trend model?

These questions are answered by process, not prediction.

The Bottom Line

You can’t control what the market will do. But you can control how much you lose when it goes against you—and how much you stand to gain when it moves in your favor. That’s the essence of asymmetric trading.

At Shell Capital, we don’t buy into narratives. We build structures—each position engineered with defined risk, convex payoff potential, and alignment with broader portfolio dynamics.

Asymmetry isn’t found in an undervalued stock. It’s created by how the position is constructed.

Shell Capital Management, LLC pursues asymmetric investment returns by actively managing risk and dynamically adapting to evolving markets. We manage each client portfolio directly, not as advisors telling you what to do—but as the portfolio manager executing our disciplined process on your behalf.

DISCLOSURE: This content is for informational purposes only and not investment advice. Investing involves risk, including the risk of loss. There is no guarantee that any strategy will achieve its objectives. Shell Capital Management, LLC is a registered investment advisor. Options involve risk and are not suitable for all investors. Prior to buying or selling an option, individuals must receive a copy of Characteristics and Risks of Standardized Options, available at http://www.theocc.com. Investing involves risk, including possible loss of capital. Nothing in this communication should be considered personalized investment advice. Shell Capital Management, LLC, manages portfolios directly on behalf of our clients using disciplined risk management and asymmetric strategies.

Exit Planning Is the Rotation Event

Most people think financial freedom happens gradually.

It usually doesn’t.

For business owners, it happens all at once — at the moment when effort-based income is converted into capital.

That moment is the exit.

Until then, even the most successful owner is still on the treadmill.

What is exit planning? 

Exit planning is a strategic process used by business owners to prepare for leaving their company, aiming to maximize business value, minimize taxes, and ensure a smooth ownership transition. It involves creating a roadmap that addresses financial, legal, and personal goals, often including contingency plans for unforeseen events like illness or death. 

Why High Income Isn’t Financial Freedom

Running a profitable business feels like independence, but structurally it isn’t.

Before an exit:

Cash flow depends on operations

Risk is concentrated in one asset

Time is still the binding constraint

You may delegate.
You may scale.
You may earn more than you ever imagined.

But if the business stops, the engine stops.

That’s not freedom. That’s exposure.

Exit Planning Isn’t About Leaving the Business

This is where most people misunderstand the purpose of exit planning.

It isn’t about quitting.
It isn’t about retirement.
It isn’t even about timing the market for buyers.

Exit planning is about rotating the source of cash flow.

From:

Human capital → financial capital

Operational risk → portfolio risk

One concentrated bet → engineered diversification

It’s the single largest transition most business owners will ever make — and it’s binary, not gradual.

The Moment You Step Off the Treadmill

When a business is sold, something fundamental changes.

For the first time:

Income no longer requires management

Time becomes optional

Risk can be deliberately defined instead of endured

This is the true transition into the investor level — not because someone now “has money,” but because capital can finally be put to work without consuming the owner’s life.

Liquidity creates freedom only if it’s handled correctly.

Why Selling the Business Isn’t Enough

Here’s the uncomfortable truth.

Many business owners sell their companies and immediately build a new treadmill.

They replace operational stress with:

Market anxiety

Volatility fear

Reactionary decision-making

Poor timing driven by emotion instead of structure

Without a process, capital becomes just another job — one people are often far less prepared to manage than the business they just sold.

Being an investor isn’t passive by default.
It’s passive only when risk is engineered.

What Keeps You Off the Treadmill After the Exit

This is where portfolio management matters — not as performance chasing, but as system design.

At Shell Capital, our role begins where the business ends.

We don’t ask former owners to suddenly become money managers.
We replace the treadmill with an engineered framework:

  • Defined downside risk
  • Portfolio-level drawdown controls
  • Multiple uncorrelated return drivers
  • Intentional asymmetry between risk and reward

The goal isn’t maximum return in any given year.
It’s durability, optionality, and control over outcomes.

That’s what allows capital to support life instead of dominate it.

From Owner to Investor to Steward

Exit planning rotates someone into the investor level.

Risk management is what allows them to stay there.

The endgame isn’t doing nothing.
It’s choosing what matters without financial pressure distorting decisions.

That’s the real meaning of getting off the treadmill.

The ASYMMETRY® Takeaway

Selling a business creates liquidity.
Exit planning creates the transition.
Risk-managed portfolio construction creates freedom.

Miss any one of those, and the treadmill never really stops.

Mike Shell is the founder of Shell Capital Management, a registered investment adviser that advises founders and owners of businesses on all things financial and exit planning. Shell Capital uniquely advises owners as a fiduciary, acting solely in the founders’ best interest before, during, and after the sale of a company. 

Asymmetric Pressure in the U.S. Dollar: AVWAP Shows Who’s Losing

Imagine you could see the average cost basis of all the buyers since a big event (like a high, a low, or a breakout day).

That’s what AVWAP (Anchored Volume Weighted Average Price) shows us.

Here is the Anchored VWAP of the U.S. Dollar Index. 

(Actually, it’s a U.S. dollar futures contract, which we need to quantitatively analyze real trade data.   This is for educational purposes only. Futures involve risk and are not  suitable for all investors.)

Most traders who bought the U.S. dollar since the January and April anchor points (white lines) are underwater, signaling selling pressure and reinforcing the downtrend.

AVWAP is a quantitative technical analysis method we use in tactical position trading to help identify potential support and resistance levels. Anchored VWAP calculates the average price of a security, weighted by its volume, from our defined starting point, providing a dynamic perspective on price action.

AVWAP helps us see who’s winning or losing based on volume and time.

When price is below AVWAP, most traders who bought since that anchor date are likely losing — and may sell if prices rise.

When price is above AVWAP, most are winning — and may hold or even add more.

In the case of the U.S. dollar:

Both AVWAPs are above the current price = the majority of buyers are losing = more pressure to sell = may signal continued selling pressure unless the price can reclaim key levels.

It’s not a prediction or recommendation to buy or sell the USD but an observation of current market structure using AVWAP as a tool to assess where buying pressure or selling pressure may exist based on volume-weighted positioning.

It highlights how price action relative to key levels may influence behavior, not predict future outcomes.

It tells us buyers are underwater:

Most traders who bought since those anchored dates paid more than the current price.

That’s a psychological and behavioral cue — underwater (losing) positions tend to get sold into rallies.

Overhead supply exists:

Every time price trends up to one of those AVWAPs, traders stuck at higher prices may sell to break even — creating potential resistance to higher prices because of their selling pressure. 

Momentum favors sellers:

Price being below both AVWAPs suggests sellers have had control since both anchor points. The trend hasn’t reversed.

Trend above the AVWAP = possible regime shift:

If price can rise and hold above one or both AVWAPs, it would mean buyers are taking control again — a potential shift in market behavior.

In other words:

This isn’t predicting where price will go — it’s revealing where pressure currently exists based on buyer positioning and helping you assess whether risk/reward favors continuation or reversal.

Mike Shell is the founder and chief investment officer of Shell Capital Management, LLC, and the portfolio manager of ASYMMETRY® Managed Portfolios, a separately managed account program with trade execution and custody at Goldman Sachs Custody Solutions. Mike Shell and Shell Capital Management, LLC, a registered investment advisor focused on asymmetric risk-reward and absolute return strategies, provide investment advice and portfolio management only to clients with a signed and executed investment management agreement. The observations shared on this website are for general information only and should not be construed as investment advice to buy or sell any security. This information does not suggest in any way that any graph, chart, or formula offered can solely guide an investor as to which securities to buy or sell, or when to buy or sell them. Securities reflected are not intended to represent any client holdings or recommendations made by the firm. In the event any past specific recommendations are referred to inadvertently, a list of all recommendations made by the company within at least the prior one-year period may be furnished upon request. It should not be assumed that recommendations made in the future will be profitable or will equal the performance of the securities on the list.  Any opinions expressed may change as subsequent conditions change. Please do not make any investment decisions based on such information, as it is not advice and is subject to change without notice. Investing involves risk, including the potential loss of principal an investor must be willing to bear. Past performance is no guarantee of future results. All information and data are deemed reliable but are not guaranteed and should be independently verified. The presence of this website on the Internet shall in no direct or indirect way raise an implication that Shell Capital Management, LLC is offering to sell or soliciting to sell advisory services to residents of any state in which the firm is not registered as an investment advisor. The views and opinions expressed in ASYMMETRY® Observations and Asymmetric Investment Returns are those of the authors and do not necessarily reflect the position of Shell Capital Management, LLC. The use of this website is subject to its terms and conditions.

Drawdown Control is Essential for Compounding Efficiency

We pursue what we refer to as “drawdown control” through individual position risk management, portfolio heat limits, and portfolio hedging for risk mitigation. 

Compounding efficiency isn’t about how much we make—it’s about how much we keep compounding.

If we start with $1,000,000 and compound at 10% annually, in 10 years, we’d have $2.59 million.

But take a -50% hit early on—it’s down to $500,000.

Now compound that same 10% for 10 years…

You end up with only $1.29 million.

That one drawdown cost $1.3 million—and a full decade of progress.

That’s the hidden cost of large losses: not just money, but time, momentum, and optionality.

Asymmetric trading systems structure trades with drawdown controls so we don’t need to recover—because we never fall that far to begin with. 

It’s a core concept of ASYMMETRY®.

Drawdowns from Market Losses Work Geometrically Against You

Investment Drawdowns from Market Losses Work Geometrically Against You

Losses don’t scale linearly—they scale exponentially in how they hurt compounding.

A -10% loss requires +11.1% to recover

A -20% loss needs +25%

A -50% loss needs +100%

A -90% loss needs +900%

Why? 

Because you’re always growing from a smaller base.

That’s the geometric trap: each deeper loss shrinks the capital available to compound. 

You’re not just losing money—you’re losing the very engine of growth.

It’s why ASYMMETRY® emphasizes risk management first by predetermining exits in advance, monitoring portfolio risk in real time, and hedging with convexity when there’s an edge. 

ASYMMETRY® Artificial Intelligence as Portfolio Infrastructure

Most discussions about AI in investing focus on tactics.

That’s a mistake.

Artificial intelligence is not a trade. It’s not an asset class. And it’s not a return driver by itself. Treated that way, it becomes fragile and dangerous.

ASYMMETRY® Artificial Intelligence is designed as portfolio infrastructure — invisible when it’s working, indispensable when it’s needed.

Just as plumbing doesn’t create wealth but prevents disasters, AI in serious capital management exists to maintain system integrity. It ensures that portfolio construction behaves as designed, even as markets change.

This infrastructure operates across the entire portfolio, not at the position level.

It monitors aggregate exposure.
It evaluates concentration across strategies and regimes.
It tracks how correlations evolve under stress.

Without this layer, portfolios appear diversified until they aren’t.

ASYMMETRY® Artificial Intelligence strengthens portfolio architecture by continuously stress-testing assumptions that humans make implicitly and forget to revisit. It doesn’t assume yesterday’s diversification holds tomorrow. It doesn’t assume volatility regimes persist. It doesn’t assume liquidity is always available.

Infrastructure thinking matters because asymmetric investing depends on survival.

Defined downside only works if it’s enforced across the portfolio.
Optionality only matters if capital is intact when it appears.

AI supports this by acting as a real-time integrity check on the entire system.

Crucially, ASYMMETRY® Artificial Intelligence does not optimize portfolios for maximum return. It optimizes them for resilience, adaptability, and rule adherence.

That distinction separates serious capital management from speculative experimentation.

Artificial intelligence belongs in the same category as custody, compliance, and risk controls—foundational, not promotional.

When AI is treated as infrastructure, it quietly compounds its value over time.

When it’s treated as a strategy, it eventually fails.

Market Breadth Thrust: Bullish Percent Breakouts Signal Asymmetric Upside Potential

Market internals have flipped bullish—sharply. 

As of April 24, 2025, all three major Bullish Percent Indexes have confirmed significant upward reversals in participation, with the Nasdaq Bullish Percent exploding higher in a breadth thrust.

Here’s what just happened and why it matters for identifying asymmetric opportunities in trend acceleration phases.

What Is a Bullish Percent Index?

The Bullish Percent Index (BPI) measures the percentage of stocks within a given index that are currently on Point & Figure buy signals. It’s not about price—it’s about participation in an uptrend. These breadth indicators help us gauge the internal health of markets beneath the surface. It’s what individual equities are doing. 

Each of these charts uses:

  • 2% box size
  • 3-box reversal
  • Point & Figure charting to eliminate noise and focus on structural shifts
  • Bullish signals triggered when a column of Xs exceeds the prior X column (a breakout in participation)

What the Data Shows

We now have fresh signals from all three core indexes:

$BPNYA – NYSE Bullish Percent Index

  • Signal: Bull Alert triggered April 14, 2025
  • Current Level: 46.56% Read: 46% of NYSE-listed stocks have signaled short-term uptrends. 
  • Insight: Early-stage reversal from oversold levels (<30%) suggests broad market participation is beginning to recover—but still below the 50% threshold. This implies cautious optimism for NYSE-listed stocks, which are primarily value, dividend, and small/mid-cap. 

$BPSPX – S&P 500 Bullish Percent Index

  • Signal: Bull Confirmed on April 24, 2025
  • Current Level: 61.60%  Read: 61% of S&P 500 stocks have signaled short-term uptrends. 
  • Insight: Countertrends in large-cap U.S. stocks are now breaking out. This confirmation marks a transition from recovery to potential trend continuation in the broader U.S. equity index.

$BPNDX – Nasdaq 100 Bullish Percent Index

  • Signal: Bull Confirmed on April 24, 2025
  • Current Level: 65.00% (up a staggering +12.07% in one day)
  • Insight: This is the most aggressive signal—high-beta growth names in the Nasdaq 100 just posted a vertical surge in internal buy signals. Explosive convexity is taking shape in tech and innovation-heavy equities.

Comparison Table: Breadth Regime Shift

Index

Signal Type

Level

1-Day Change

Breadth Regime

$BPNYA

Bull Alert

46.6%

+1.76%

Neutral to bullish

$BPSPX

Bull Confirmed

61.6%

+1.99%

Bullish continuation

$BPNDX

Bull Confirmed

65.0%

+12.07%

High-convexity breakout

Asymmetric Insight: Countertrend Convexity Is Expanding

This is what asymmetric traders look for.

  • In early trend reversal stages, breadth signals like Bull Alert ($BPNYA) hint that downside may be naturally limited while upside potential opens up. (For true asymmetric risk/reward, downside isn’t capped without a predefined exit or through options.
  • In bull confirmed phases ($BPSPX, $BPNDX), the number of stocks generating buy signals is accelerating—a positive feedback loop.
  • The Nasdaq 100’s explosive 12% breadth thrust may serve as a leading indicator for broader market risk appetite, offering convex setups in tech and growth.

For investors and traders seeking asymmetry by identifying trends early and capitalizing on them until they change, these are fertile conditions: the downside may be naturally limited, can be truly capped with a predetermined exit, and upside participation is expanding.

We now have confirmation across large-cap, tech, and broad market indexes. This isn’t a prediction—it’s a shift in internal structure. When multiple Bullish Percent Indexes confirm strength simultaneously, it may be the start of something bigger.

Shell Capital pursues asymmetric investment returns by actively managing risk and dynamically adapting to evolving market regimes. I’ve been monitoring Bullish Percents for nearly thirty years now, but they aren’t the only indicators we use to signal trends. It’s one of many methods we use to weigh the evidence. For example, I shared on April 7th the stock market was washed out in “Market Breadth Collapse Intensifies: Monitoring for Countertrend Setups with Asymmetric Risk/Reward.”

After we’ve de-risked the possibility of loss as we did in February (see Weakening Trend, Options Expiry, and Systematic Flows Create an Asymmetric Risk-Reward Skewed to the Downside), our next move is to look for selling pressure to dry up and buying demand to take over. 

Mike Shell

Mike Shell is the founder and chief investment officer of Shell Capital Management, LLC, and the portfolio manager of ASYMMETRY® Managed Portfolios, a separately managed account program with trade execution and custody at Goldman Sachs Custody Solutions. Mike Shell and Shell Capital Management, LLC, a registered investment advisor focused on asymmetric risk-reward and absolute return strategies, and profivides investment advice and portfolio management only to clients with a signed and executed investment management agreement. The observations shared on this website are for general information only and should not be construed as investment advice to buy or sell any security. This information does not suggest in any way that any graph, chart, or formula offered can solely guide an investor as to which securities to buy or sell, or when to buy or sell them. Securities reflected are not intended to represent any client holdings or recommendations made by the firm. In the event any past specific recommendations are referred to inadvertently, a list of all recommendations made by the company within at least the prior one-year period may be furnished upon request. It should not be assumed that recommendations made in the future will be profitable or will equal the performance of the securities on the list. Any opinions expressed may change as subsequent conditions change. Please do not make any investment decisions based on such information, as it is not advice and is subject to change without notice. Investing involves risk, including the potential loss of principal an investor must be willing to bear. Past performance is no guarantee of future results. All information and data are deemed reliable but are not guaranteed and should be independently verified. The presence of this website on the Internet shall in no direct or indirect way raise an implication that Shell Capital Management, LLC is offering to sell or soliciting to sell advisory services to residents of any state in which the firm is not registered as an investment advisor. The views and opinions expressed in ASYMMETRY® Observations and Asymmetric Investment Returns are those of the authors and do not necessarily reflect the position of Shell Capital Management, LLC. The use of this website is subject to its terms and conditions.


VIX Futures Still in Backwardation: What This Shift Tells Us Now

The VIX futures curve continues to send a clear message: volatility remains elevated, and the market still expects it to fade—but not just yet.

As of today, the spot VIX Index is at 42.65, while the front-month VIX future (April) is at 34.94. That’s a nearly 8-point gap, or about a 19% premium of spot over front-month futures.

In short, the curve is still in backwardation—just less extreme than it was a few days ago.

What the Term Structure Is Telling Us

  • Spot VIX remains well above every futures contract from April through November.
  • The curve slopes downward, from 34.94 in April to 22.40 in November.
  • The market is still pricing in elevated short-term fear that it expects to fade over time.

This reflects a dynamic we often see in volatility events: front-loaded fear, followed by an assumption that conditions will stabilize in the coming months.

What It’s Not Telling Us

This is not a sign that the volatility event has ended.

If the volatility spike were over, we’d expect to see:

  • Spot VIX collapsing.
  • Futures flattening or shifting into contango.
  • The front of the curve pulling higher relative to the back.

But we’re not seeing that yet.

Spot is still elevated. The curve is still sloped downward. We’re still in the fear regime.

No Asymmetric Edge Yet on Short Vol

This setup—spot > entire curve—remains a danger zone for short volatility.

Yes, the market expects VIX to mean revert. But until spot begins to converge toward the curve, there is no clear asymmetric short-volatility setup.

The asymmetric trade comes after the volatility spike starts to unwind—not before.

Until then, short vol remains a trade with uncapped downside and little-to-no edge.

The Bottom Line

  • Spot VIX = 42.65
  • Front-month future = 34.94
  • Curve still in backwardation, but less extreme
  • Market still in a volatility regime
  • No edge yet for short vol trades

As always, the edge lies in waiting for volatility to start collapsing, not guessing when the collapse will begin.

Until then, we wait.

The Case for Limiting Drawdowns Through Active Risk Management and Hedging: The Math Behind Efficient Compounding

Losses are asymmetric. 

As the chart shows, a -10% loss only requires an 11% gain to recover, but a -50% loss demands a 100% return just to get back to breakeven. The deeper the drawdown, the more exponential the required recovery—this destroys compounding efficiency.

This is why we define risk in advance and actively cap drawdowns, especially beyond the ~15–20% range.

Below that threshold, capital can still recover reasonably well. Beyond it, recovery becomes a mathematical uphill battle.

To compound capital efficiently over time, downside risk must be actively mitigated. The key to long-term wealth creation isn’t just capturing upside—it’s protecting capital through asymmetric risk/reward positioning and strict portfolio risk exposure limits.

For more than two decades, the edge of Shell Capital has been risk mitigation through active risk management, drawdown controls, and asymmetric hedging. As a registered investment adviser, we manage your investment portfolio for you.

Contact us about ASYMMETRY® | Managed Portfolios, an alternative investment program beyond traditional asset allocation and ASYMMETRY® | Hedging, dynamic portfolio hedging with options for convex payoffs. 

Invest with us! 

Market Breadth Collapse Intensifies: Monitoring for Countertrend Setups with Asymmetric Risk/Reward

The latest internal market data shows a broad collapse in demand and increase in selling pressure across all major S&P 500 sectors.

The percentage of stocks trading above key moving averages—from 5-day to 200-day—has declined sharply. While short-term trend damage is now widespread, we’re beginning to see conditions where countertrend setups with convexity potential may form.

It’s a signal to prepare for an eventual countertrend. 

At Shell Capital, we’ve been tactically trading for more than two decades. When this kind of environment takes shape, we pay close attention because it sets the stage for asymmetric opportunity.

Uptrends in the S&P 500 Stocks Have Vanished

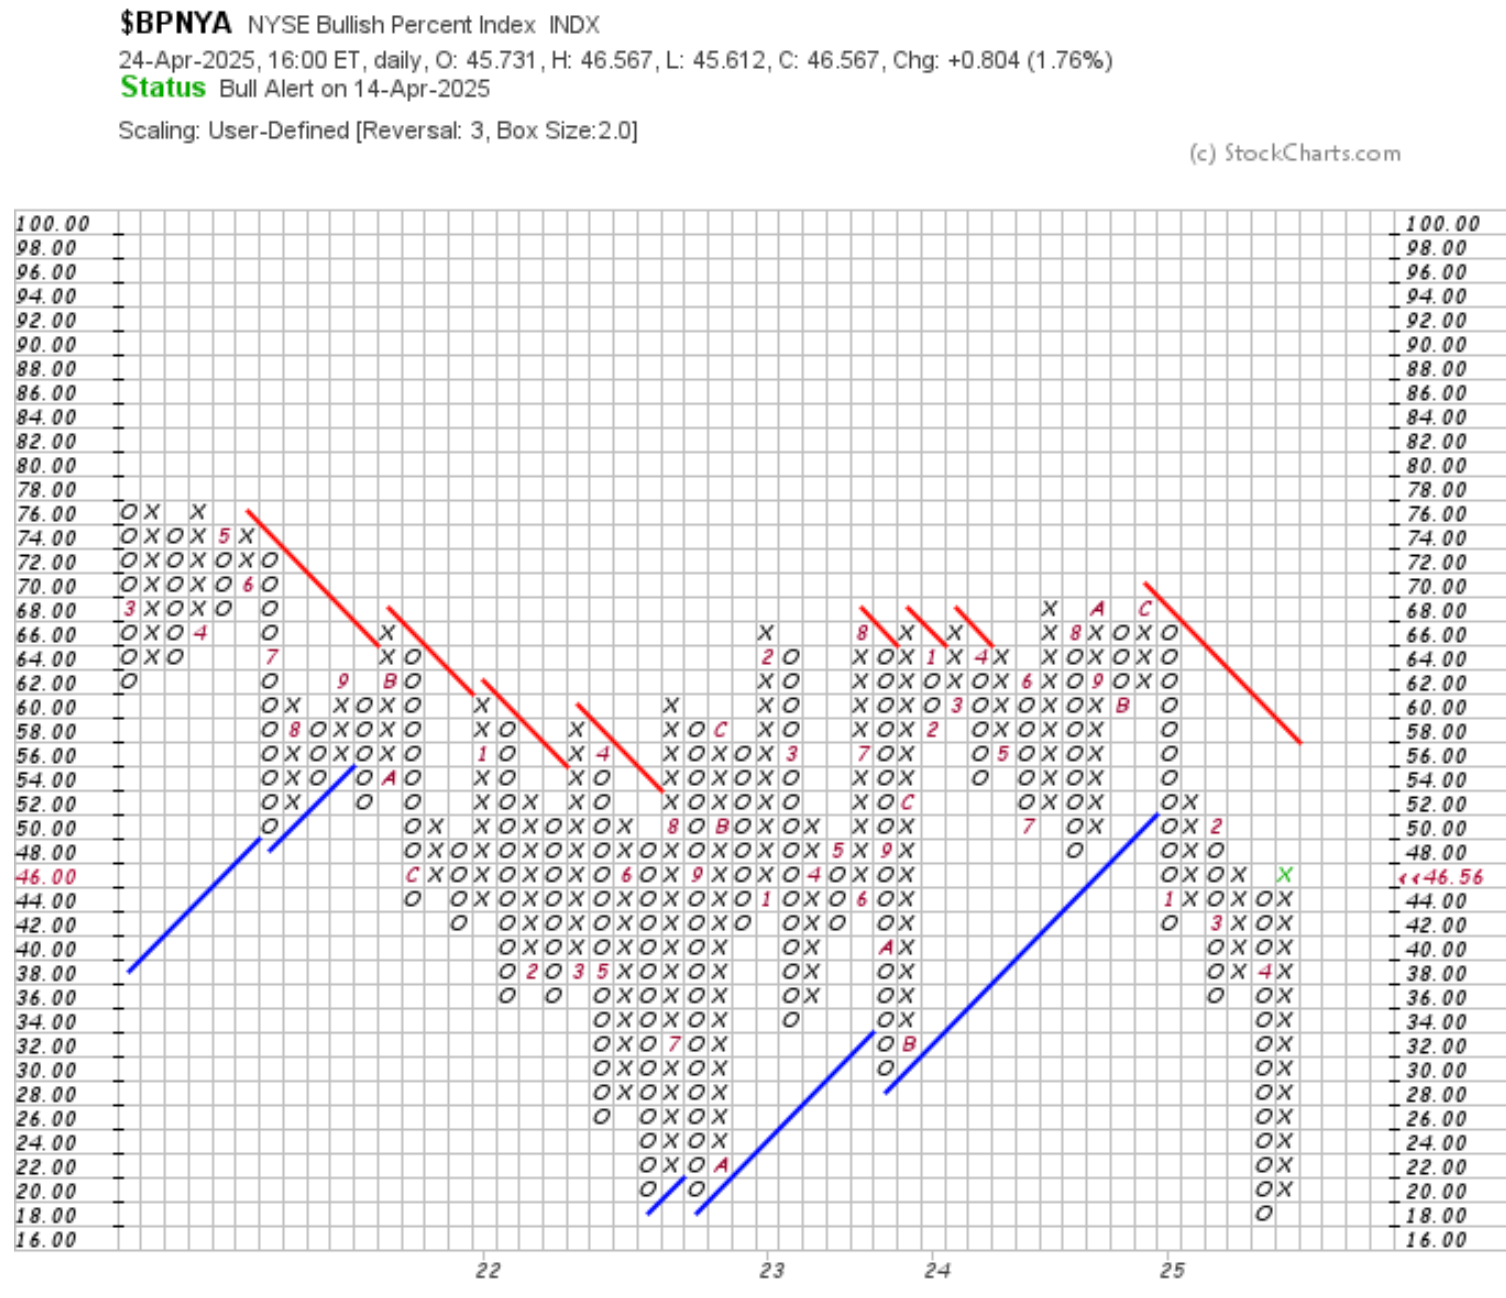
In the sector snapshot, seven sectors have zero percent of their stocks trading above the 5-day and 20-day moving averages. Technology, Energy, Materials, Industrials, and Communication Services are effectively in a state of internal collapse. Even Consumer Discretionary and Financials show only marginally better participation.

That kind of uniform breakdown is rare—and when it happens, it often reflects short-term downside exhaustion occurring as those with a desire to sell are selling, and eventually they’ve all sold. 

Longer-Term Trend Structure Is Breaking

Looking further out to the 100-day, 150-day, and 200-day moving averages, we see that most sectors are structurally deteriorating.

Only Utilities and Communication Services have more than 30% of their stocks above the 200-day average.

Sectors like Technology, Energy, and Materials are below 10%.

This confirms that the trend damage is not just short-term—it’s now impacting long-term structure across the market. It’s also important to note the more defensive sectors were initially holding up, but have now collapsed, too.

It indicates the current downtrend is likely going to eventually expand into a longer-term trend.

Even in a long-term bear market, there are shorter-term, potentially tradeable countertrends along the way.

Where Convexity Conditions Are Forming

I pointed out in Forced Systematic Selling Eventually Drives Asymmetric Opportunities for Convexity we believe there remains some selling pressure from systematic trading programs.  So, exhaustion of their forced selling could eventually be overtaken by buying demand if prices have been pushed down to a low enough point to attract enthusiasm. 

These extreme breadth readings create the conditions for convexity. When selling pressure has already washed out the majority of a sector, a small input—such as a shift in sentiment, a macro surprise, or even short-covering—can result in a disproportionately large move.

That’s convexity.

But convexity by itself doesn’t make it a trade. It creates the potential. The next step is structure.

Convexity vs. Asymmetry: The Distinction That Drives Our Discipline

At Shell Capital, we say convexity describes the shape of a potential move. Asymmetry, on the other hand, is how we engage with that potential to structure a position with positive asymmetric risk/reward. 

Convexity is a setup condition.

ASYMMETRY® is the strategy.

Convex setups emerge when the market becomes one-sided—where most participants are already de-risked or short, volatility is elevated, and very little buying can lead to a lot of movement. But that only becomes meaningful when we can define our downside and leave the upside open.

Asymmetric investment returns don’t come from forecasts. They come from structure.

  • Limiting downside through predefined exits, stop-losses, or options
  • Positioning for exponential or uncapped upside
  • Repeating the process with discipline and consistency

This is how we operate. It’s what we call ASYMMETRY®.

It’s also essential to realize markets can always crash harder and stay down longer. 

Sector Highlights

Technology, Energy, Materials, and Industrials now exhibit the most extreme internal breakdowns. These sectors have the highest potential convexity—if selling pressure exhausts. Health Care and Real Estate are weak but not fully washed out. Utilities remains a relative strength leader and may act as a defensive rotation magnet rather than a countertrend candidate.

This divergence between sectors helps us identify where potential setups may emerge and where capital may rotate next.

The Bottom Line

The market’s internal breadth collapse has intensified. While we are not yet seeing clear signals of reversal, the structure beneath the surface is setting up the conditions where asymmetric opportunity may form.

It’s not about predicting turning points—it’s about structuring positions only when we can clearly define risk and leave upside open. When market prices have already collapsed, it just increases the probability we’ll eventually see a tradable countertrend move. We base it on decades of experience tactically operating through these changing conditions and the systems we’ve developed along the way to quantify risks and rewards. 

I think we’ll eventually see the selling pressure dry up, and then we’ll look for confirmation buyers have taken control. From there, we’ll see if follow-through is enough to drive a sustained uptrend or if it instead reverses back down to a lower low as it did before, as I discussed in The Stock Market Risk/Reward Asymmetry Has Shifted

However, in the longer view, the probabilities have increased significantly the U.S. economy will enter a recession, which also increases the likelihood of a longer sustained bear market. Even though we should see at least a short-term countertrend move, the odds are high it’ll eventually reverse back down to an even lower low. Since it’s probabilistic and never a sure thing, it’s essential to dynamically mitigate risk with predefined exits or hedging to limit drawdowns. 

Mike Shell

Mike Shell is the founder and chief investment officer of Shell Capital Management, LLC, and the portfolio manager of ASYMMETRY® Managed Portfolios, a separately managed account program with trade execution and custody at Goldman Sachs Custody Solutions. Mike Shell and Shell Capital Management, LLC, a registered investment advisor focused on asymmetric risk-reward and absolute return strategies, and profivides investment advice and portfolio management only to clients with a signed and executed investment management agreement. The observations shared on this website are for general information only and should not be construed as investment advice to buy or sell any security. This information does not suggest in any way that any graph, chart, or formula offered can solely guide an investor as to which securities to buy or sell, or when to buy or sell them. Securities reflected are not intended to represent any client holdings or recommendations made by the firm. In the event any past specific recommendations are referred to inadvertently, a list of all recommendations made by the company within at least the prior one-year period may be furnished upon request. It should not be assumed that recommendations made in the future will be profitable or will equal the performance of the securities on the list. Any opinions expressed may change as subsequent conditions change. Please do not make any investment decisions based on such information, as it is not advice and is subject to change without notice. Investing involves risk, including the potential loss of principal an investor must be willing to bear. Past performance is no guarantee of future results. All information and data are deemed reliable but are not guaranteed and should be independently verified. The presence of this website on the Internet shall in no direct or indirect way raise an implication that Shell Capital Management, LLC is offering to sell or soliciting to sell advisory services to residents of any state in which the firm is not registered as an investment advisor. The views and opinions expressed in ASYMMETRY® Observations and Asymmetric Investment Returns are those of the authors and do not necessarily reflect the position of Shell Capital Management, LLC. The use of this website is subject to its terms and conditions.


A Recap of Our Tactical Trading Observations as Through the Waterfall Decline

The stock market indexes are in bear market territory, with the S&P 500 down ~18% and Nasdaq ~21% from their highs two months ago. 

Heere we share a recap of our tactical trading observations since the market peak to get a sense of how we mitigated the carnage. 

First, let’s give some context of where I’m coming from for those who don’t know. I’m actively monitoring thousands of market trends and other data every day. I use systems I started developing more than two decades ago, and those systems have evolved with the use of machine learning. 

It’s important to realize this market top and subsequent drawdown started well before any threats of tariffs, which are currently getting the headlines. 

It’s never as simple as an ON/OFF switch. Market trends unfold, and Bayesian probabilities change accordingly. What you’ll read here are these trends unfolding over the last two months. This is how we mitigated the risks by derisking and hedging in a advance of the selloff. 

I first saw the trend changing on February 12, 2025. You can click the titles to read the full observation. 

The Trend Remains Up for the Stock Market, But Risk is Increasing as the Trend is Weakening

On February 21, 2025, we pointed out hedge funds wre getting selective. 

Hedge Funds are Getting Selective: Insights from Hedge Fund Positioning in Early 2025

On February 22, 2025, we turned bearish at the top of the stock market.

Weakening Trend, Options Expiry, and Systematic Flows Create an Asymmetric Risk-Reward Skewed to the Downside

On February 26, 2025, I questioned if the bond market was underpricing risk. 

Are Credit Spreads Signaling Asymmetric Risk?

March 2, 2025 I shared my insights on a memo from a famous value investor who declared the stock market was very overvalued. It’s important to note the recent price action isn’t just about tariffs. The stock market was already very overvalued and has been. 

On Bubble Watch: A Critical Look at Market Cycles for Asymmetric Investing and Trading

On March 9, 2025, we pointed out an inflection point. 

The Stock Market Risk/Reward Asymmetry Has Shifted

March 31, 2025, we had avoided the downtrend, and I shared some insights on Institutional fund flows, futures positioning data, and ETF rotation trends I had been monitoring. The driver of market trends isn’t just headlines and often it isn’t news at all. 

How Flow and Positioning Data Can Reveal Asymmetric Opportunities

April 2, 2025 I believed the market was underpricing risk of much more downside. 

The Volatility Mullet: What the VIX Curve Is Quietly Telling Us Today

April 4, 2025 I pointed out the forced selling from systematic trading funds, which is much of the downside selling pressure we’ve seen the last week. 

Forced Systematic Selling Eventually Drives Asymmetric Opportunities for Convexity

April 4, 2025 I wrote about the hardest-hit tech sector. 

The Technology Sector Just Collapsed Internally: Breadth Breakdown and Convexity Potential

As of today, April 7, 2025, I shared in Market Breadth Collapse Intensifies: Monitoring for Countertrend Setups with Asymmetric Risk/Reward the stock market is washed out, so we should see some buying demand overtake the selling pressure. However, I also add the odds of recession have increased significantly, which also raised the odds of an eventual deeper, more prolonged bear market.